QUESTION IMAGE
Question
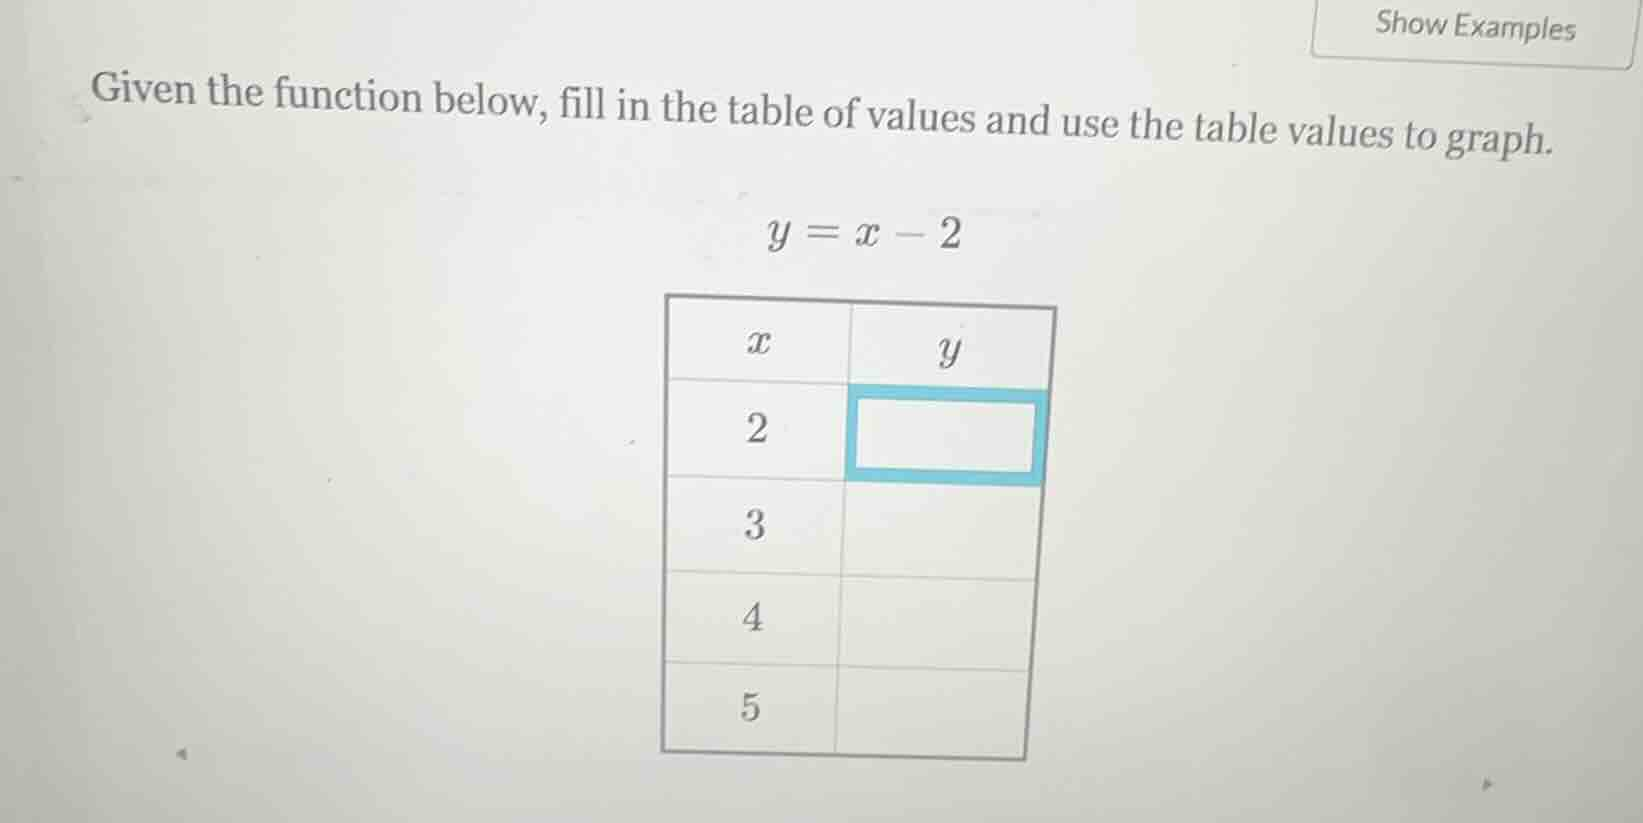
given the function below, fill in the table of values and use the table values to graph.
\\y = x - 2\\
\
$$\begin{array}{|c|c|}
\\hline
x & y \\\\
\\hline
2 & \\\\
\\hline
3 & \\\\
\\hline
4 & \\\\
\\hline
5 & \\\\
\\hline
\\end{array}$$
⚡ Using what you learned: graphing linear equations
Step 1: Calculate the y-values
Substitute each \( x \)-value from the table into the equation \( y = x - 2 \):
- For \( x = 2 \):
$$ y = 2 - 2 = 0 $$
- For \( x = 3 \):
$$ y = 3 - 2 = 1 $$
- For \( x = 4 \):
$$ y = 4 - 2 = 2 $$
- For \( x = 5 \):
$$ y = 5 - 2 = 3 $$
Step 2: Complete the table of values
| \( x \) | \( y \) |
|---|---|
| 3 | 1 |
| 4 | 2 |
| 5 | 3 |
Step 3: Plot the points to graph the line
Plot the resulting coordinate points on your coordinate plane:
- \( (2, 0) \)
- \( (3, 1) \)
- \( (4, 2) \)
- \( (5, 3) \)
Draw a straight line passing through these points.

Snap & solve any problem in the app
Get step-by-step solutions on Sovi AI
Photo-based solutions with guided steps
Explore more problems and detailed explanations
Completed Table:
- For \( x = 2 \), \( y = 0 \)
- For \( x = 3 \), \( y = 1 \)
- For \( x = 4 \), \( y = 2 \)
- For \( x = 5 \), \( y = 3 \)
Graphing Points:
Plot the points \( (2, 0) \), \( (3, 1) \), \( (4, 2) \), and \( (5, 3) \) on the grid and connect them with a straight line.