QUESTION IMAGE
Question
the following graph shows the average price of a movie ticket for the years 2009 and 2010. complete parts (a) and (b) below.
a) draw a bar graph that shows the entire scale from \\$0 to \\$8. choose the correct graph below.
Identify the data values
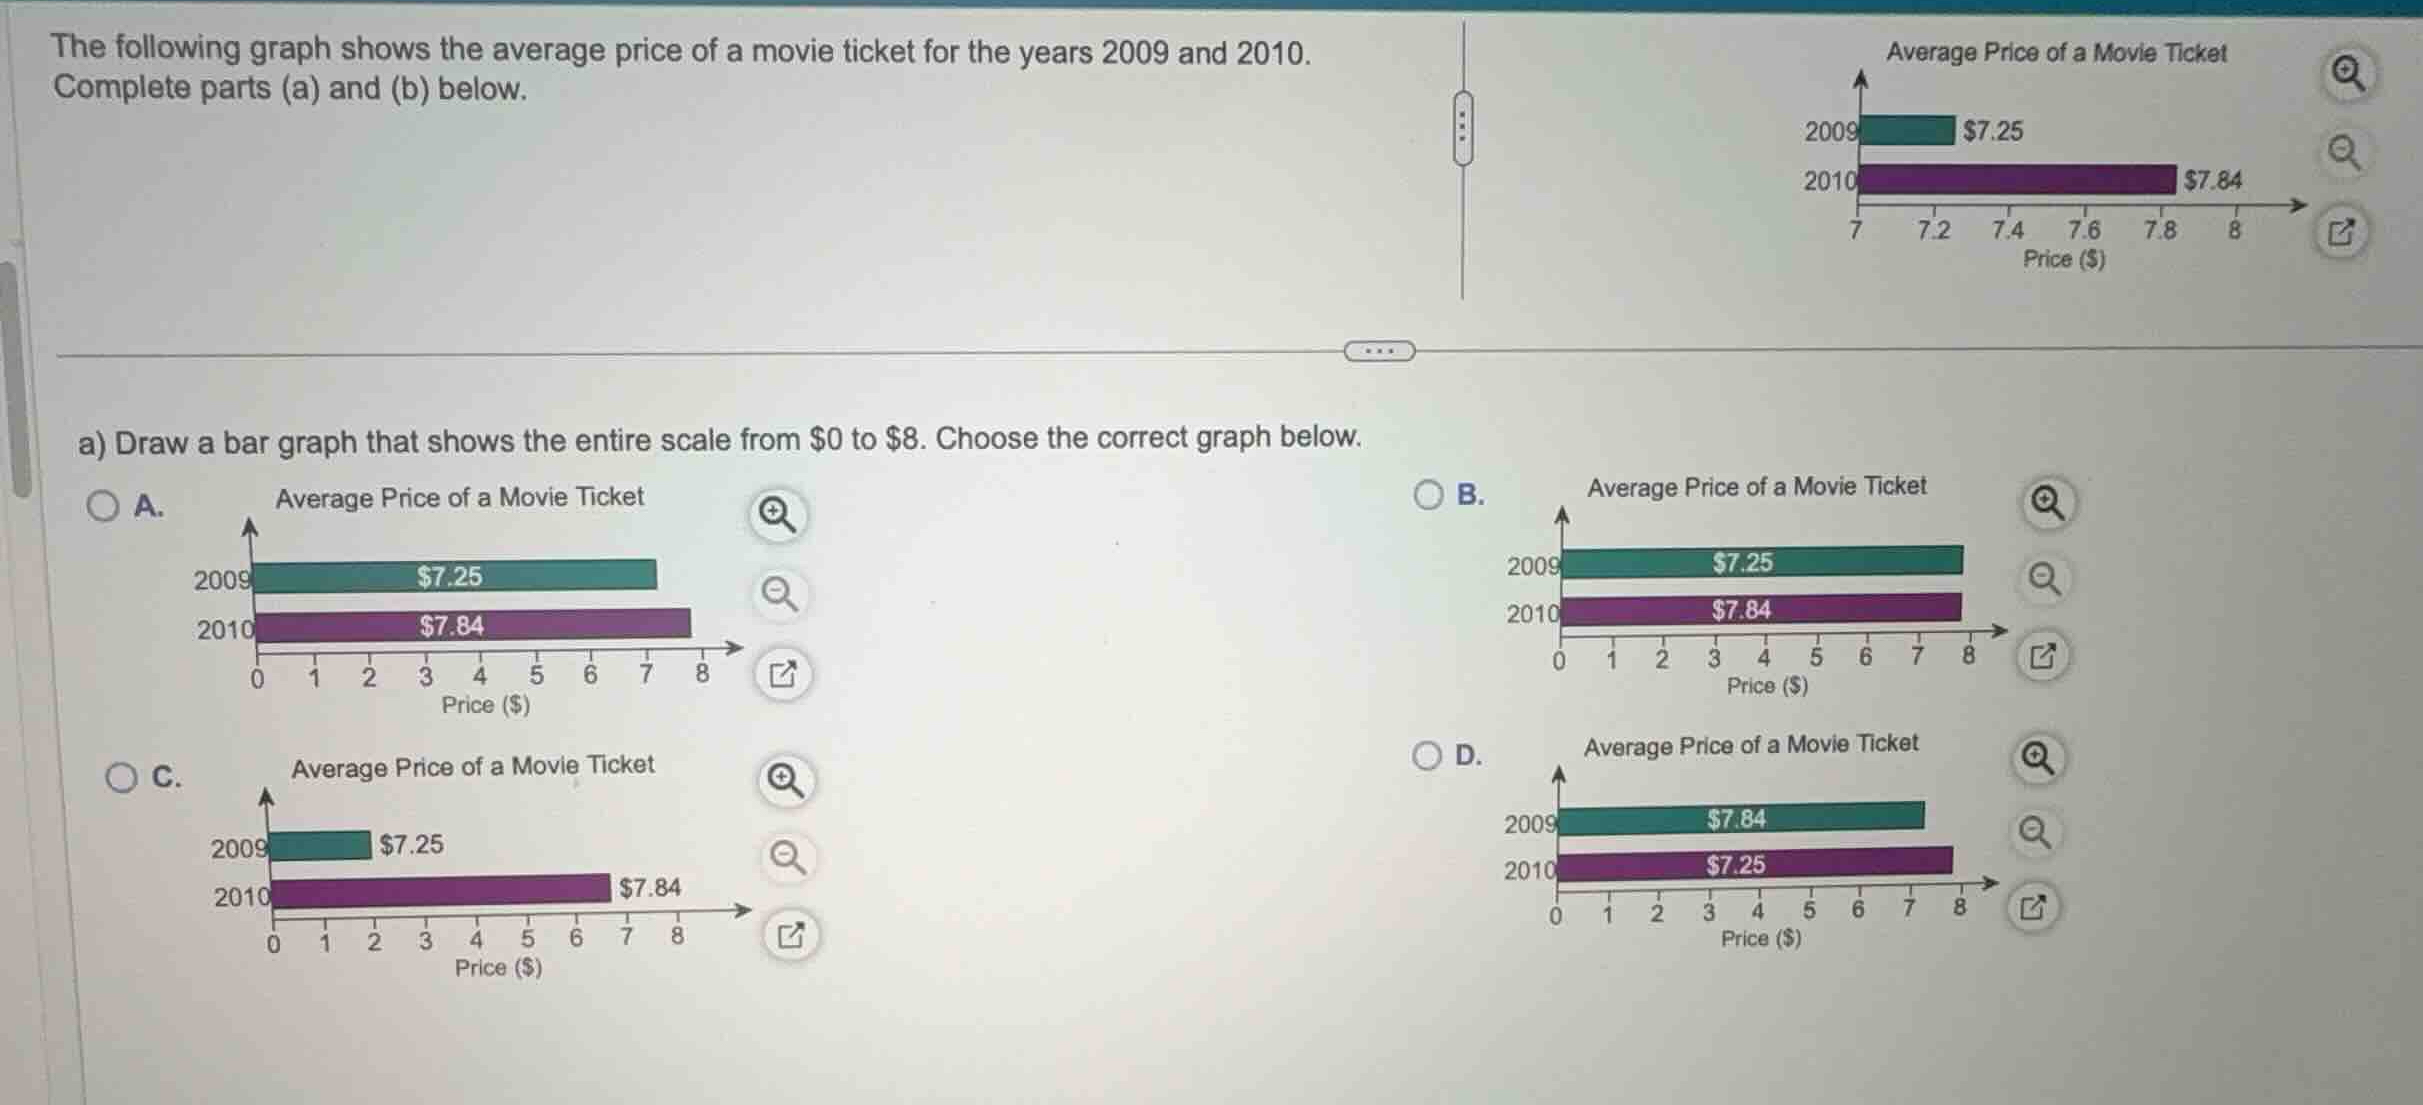
The original graph shows the average price of a movie ticket:
- For 2009: \$7.25
- For 2010: \$7.84
Analyze the scale requirements
The question asks to draw a bar graph that shows the entire scale from \$0 to \$8.
We need to evaluate each option based on:
- The horizontal axis scale must start at 0 and go to 8.
- The bar for 2009 must represent \$7.25 (ending just past 7).
- The bar for 2010 must represent \$7.84 (ending close to 8).
Evaluate the options
- Option A:
- The scale starts at 0 and goes to 8.
- The 2009 bar ends at 7.25 (just past 7).
- The 2010 bar ends at 7.84 (close to 8).
- This correctly represents the data on a full scale.
- Option B:
- The bars for both 2009 and 2010 extend all the way to 8, which is incorrect.
- Option C:
- The 2009 bar ends around 1.5 and the 2010 bar ends around 6.7, which does not match the values of \$7.25 and \$7.84.
- Option D:
- The values are swapped: 2009 is shown as longer than 2010, with 2009 ending near 7.84 and 2010 ending near 7.25.
Using Scale Distortion concepts, starting the scale at \$0 instead of \$7 provides an accurate, undistorted visual comparison of the two values. Option A is the correct graph.

Snap & solve any problem in the app
Get step-by-step solutions on Sovi AI
Photo-based solutions with guided steps
Explore more problems and detailed explanations
- (A) (Correct answer)
- (B)
- (C)
- (D)