QUESTION IMAGE
Question
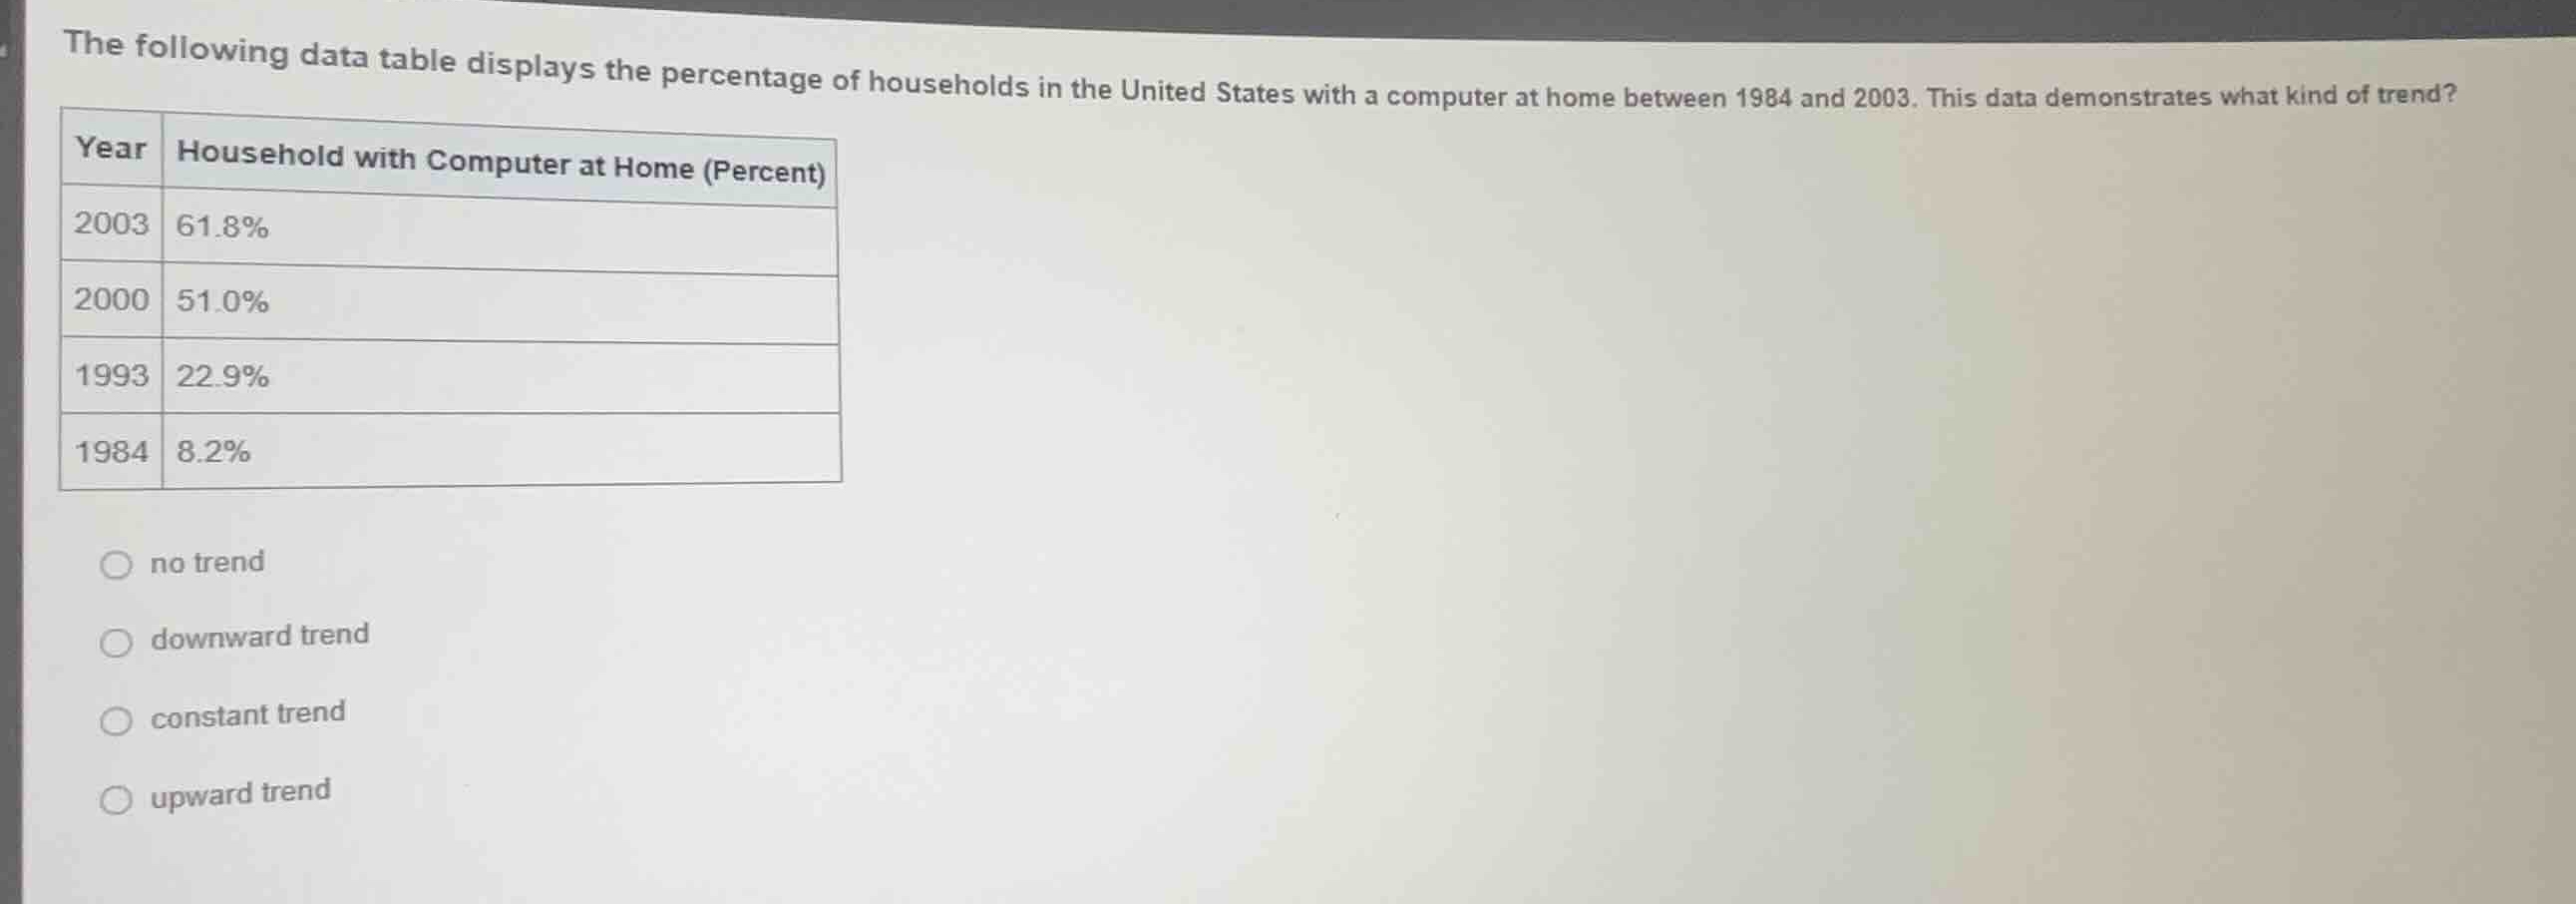
the following data table displays the percentage of households in the united states with a computer at home between 1984 and 2003. this data demonstrates what kind of trend?
year | household with computer at home (percent)
2003 | 61.8%
2000 | 51.0%
1993 | 22.9%
1984 | 8.2%
- no trend
- downward trend
- constant trend
- upward trend
Analyze the data points
Using the Trend Analysis knowledge point
$$
LATEXBLOCK0
$$
Determine the direction of change
Using the Trend Analysis knowledge point
$$
LATEXBLOCK1
$$

Snap & solve any problem in the app
Get step-by-step solutions on Sovi AI
Photo-based solutions with guided steps
Explore more problems and detailed explanations
- no trend
- downward trend
- constant trend
- upward trend (Correct answer)