QUESTION IMAGE
Question
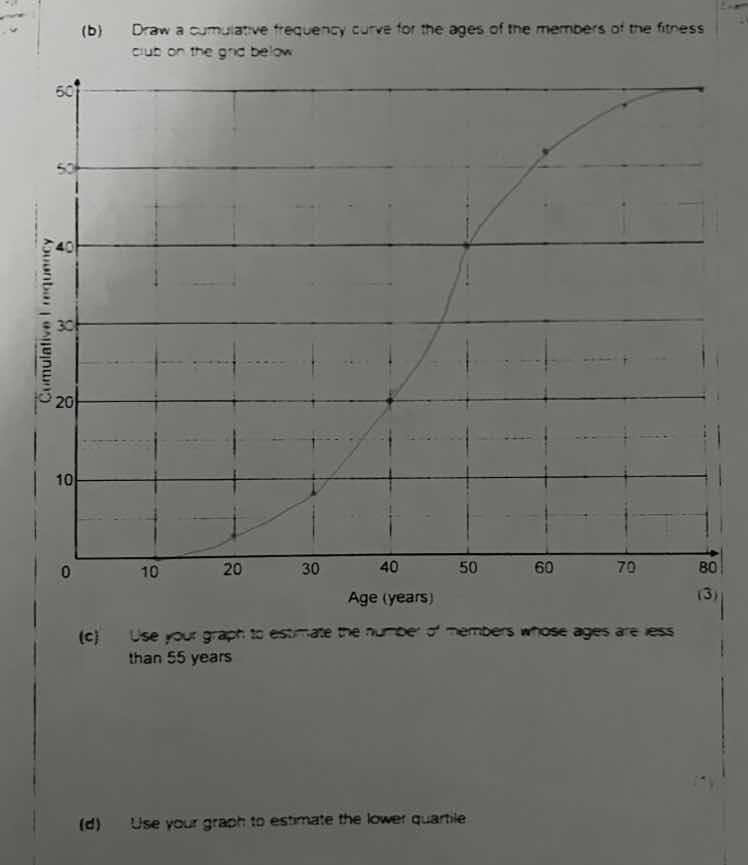
(b) draw a cumulative frequency curve for the ages of the members of the fitness club on the grid below
(c) use your graph to estimate the number of members whose ages are less than 55 years
(d) use your graph to estimate the lower quartile
<pre_analysis>
{
"quality": "clear",
"question_count": 2,
"skills_matched": [
"step_cot",
"explain_then_answer",
"tutor"
],
"needs_drawing": false,
"concepts_used": [
"Cumulative Frequency Curve",
"Quartiles"
],
"new_concepts": [
"Reading Cumulative Frequency Graphs"
],
"current_concepts": [
"Cumulative Frequency Curve",
"Quartiles",
"Reading Cumulative Frequency Graphs"
]
}
</pre_analysis>
<reasoning>
Locate age 55 on the horizontal axis
Using the Cumulative Frequency Curve concept, we find the value 55 on the horizontal axis (Age). This lies exactly halfway between 50 and 60.
Read the corresponding cumulative frequency
Move vertically up from 55 to intersect the curve, then horizontally to the vertical axis (Cumulative Frequency). The intersection point lies between 40 and 50. Looking closely at the grid, the curve passes through \(y = 47\) at \(x = 55\).
Locate the lower quartile position
Using the Quartiles concept, the total frequency is \(N = 60\). The lower quartile (\(Q_1\)) corresponds to the 25th percentile:
\[
\text{Position} = \frac{1}{4} \times 60 = 15
\]
Find the lower quartile age
Locate 15 on the vertical cumulative frequency axis. Move horizontally to intersect the curve, then vertically down to read the age. The intersection point on the curve corresponds to an age of approximately 35 years.
</reasoning>
<answer>
Question (c)
47 members
Question (d)
35 years
</answer>
<post_analysis>
{
"subject": "Mathematics",
"question_type": "Multi-part",
"knowledge_point": [
"Mathematics",
"Statistics",
"Cumulative Frequency Curve"
]
}
</post_analysis>

Snap & solve any problem in the app
Get step-by-step solutions on Sovi AI
Photo-based solutions with guided steps
Explore more problems and detailed explanations
<pre_analysis>
{
"quality": "clear",
"question_count": 2,
"skills_matched": [
"step_cot",
"explain_then_answer",
"tutor"
],
"needs_drawing": false,
"concepts_used": [
"Cumulative Frequency Curve",
"Quartiles"
],
"new_concepts": [
"Reading Cumulative Frequency Graphs"
],
"current_concepts": [
"Cumulative Frequency Curve",
"Quartiles",
"Reading Cumulative Frequency Graphs"
]
}
</pre_analysis>
<reasoning>
Locate age 55 on the horizontal axis
Using the Cumulative Frequency Curve concept, we find the value 55 on the horizontal axis (Age). This lies exactly halfway between 50 and 60.
Read the corresponding cumulative frequency
Move vertically up from 55 to intersect the curve, then horizontally to the vertical axis (Cumulative Frequency). The intersection point lies between 40 and 50. Looking closely at the grid, the curve passes through \(y = 47\) at \(x = 55\).
Locate the lower quartile position
Using the Quartiles concept, the total frequency is \(N = 60\). The lower quartile (\(Q_1\)) corresponds to the 25th percentile:
\[
\text{Position} = \frac{1}{4} \times 60 = 15
\]
Find the lower quartile age
Locate 15 on the vertical cumulative frequency axis. Move horizontally to intersect the curve, then vertically down to read the age. The intersection point on the curve corresponds to an age of approximately 35 years.
</reasoning>
<answer>
Question (c)
47 members
Question (d)
35 years
</answer>
<post_analysis>
{
"subject": "Mathematics",
"question_type": "Multi-part",
"knowledge_point": [
"Mathematics",
"Statistics",
"Cumulative Frequency Curve"
]
}
</post_analysis>