QUESTION IMAGE
Question
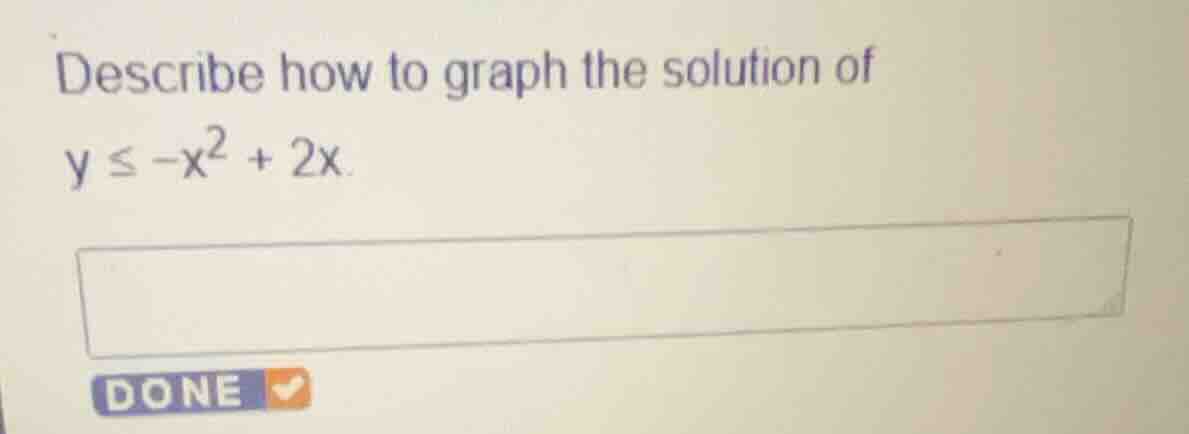
describe how to graph the solution of
\\(y \le -x^2 + 2x\\).
Identify the boundary curve and inequality type
$$
LATEXBLOCK0
$$
Determine key features of the parabola
$$
LATEXBLOCK1
$$
Determine the shaded region using a test point
$$
LATEXBLOCK2
$$

Snap & solve any problem in the app
Get step-by-step solutions on Sovi AI
Photo-based solutions with guided steps
Explore more problems and detailed explanations
To graph the solution of \(y \le -x^2 + 2x\):
- Graph the boundary parabola \(y = -x^2 + 2x\) as a solid line because the inequality includes "or equal to" (\(\le\)). The parabola opens downward with its vertex at \((1, 1)\) and x-intercepts at \((0, 0)\) and \((2, 0)\).
- Shade the region below (inside) the parabola. You can verify this by testing the point \((1, 0)\): since \(0 \le -(1)^2 + 2(1)\) is true (\(0 \le 1\)), shade the region containing this point.