QUESTION IMAGE
Question
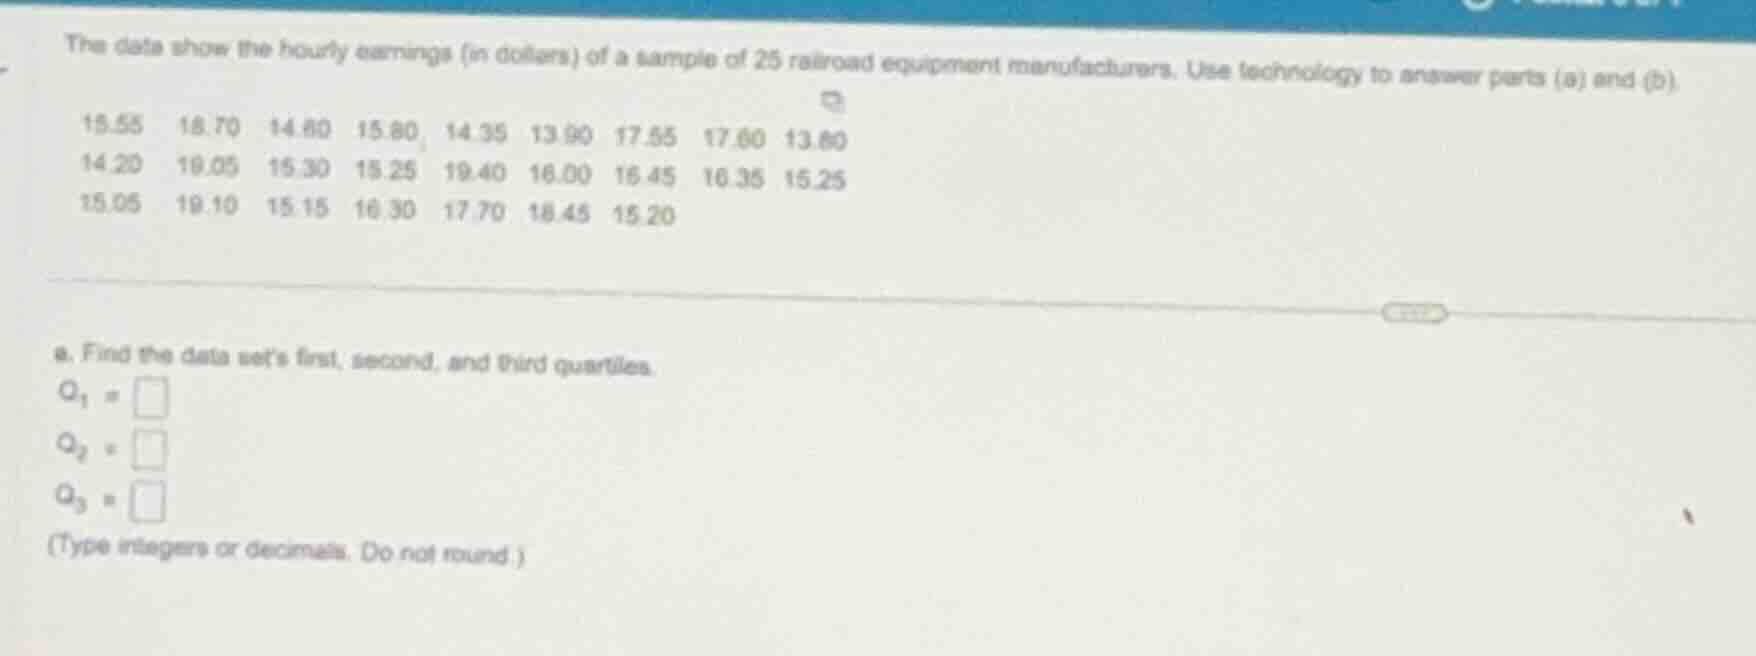
the data show the hourly earnings (in dollars) of a sample of 25 railroad equipment manufacturers. use technology to answer parts (a) and (b).
15.55 18.70 14.60 15.80 14.35 13.90 17.55 17.60 13.80
14.20 19.05 15.30 15.25 19.40 16.00 16.45 16.35 15.25
15.05 19.10 15.15 16.30 17.70 18.45 15.20
a. find the data sets first, second, and third quartiles.
\\(q_1 = \\)
\\(q_2 = \\)
\\(q_3 = \\)
(type integers or decimals. do not round.)
Sort the dataset
Using the Median Calculation knowledge point
Calculate the second quartile (Q2)
Using the Median Calculation knowledge point
Calculate the first quartile (Q1)
Using the Percentiles and Quantiles knowledge point
Calculate the third quartile (Q3)
Using the Percentiles and Quantiles knowledge point

Snap & solve any problem in the app
Get step-by-step solutions on Sovi AI
Photo-based solutions with guided steps
Explore more problems and detailed explanations
\(Q_1 = 15.1\)
\(Q_2 = 15.8\)
\(Q_3 = 17.65\)