QUESTION IMAGE
Question
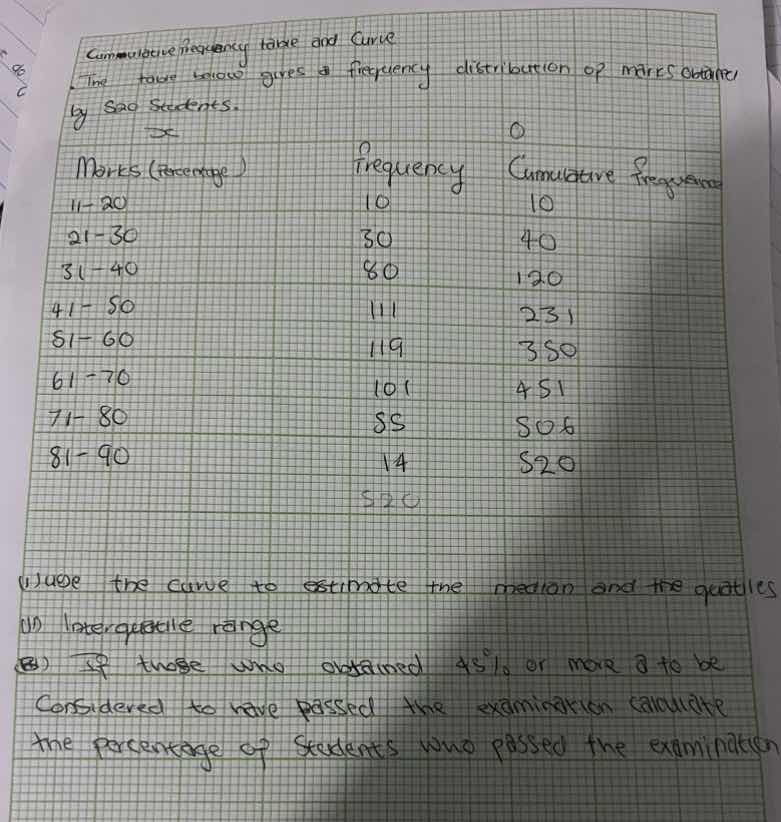
cumulative frequency table and curve
the table below gives a frequency distribution of marks obtained by 520 students.
\\(\
\\)
(i) use the curve to estimate the median and the quartiles
(ii) interquartile range
(iii) if those who obtained \\(45\\%\\) or more are to be considered to have passed the examination, calculate the percentage of students who passed the examination
Identify upper class boundaries
Using the Cumulative Frequency Curve knowledge point
To plot the cumulative frequency curve, we pair the upper class boundaries of the marks with their corresponding cumulative frequencies.
- \(20.5
ightarrow 10\)
- \(30.5
ightarrow 40\)
- \(40.5
ightarrow 120\)
- \(50.5
ightarrow 231\)
- \(60.5
ightarrow 350\)
- \(70.5
ightarrow 451\)
- \(80.5
ightarrow 506\)
- \(90.5
ightarrow 520\)
- \(10.5
ightarrow 0\) (starting point)
Estimate the median and quartiles
Using the Median and Quartiles knowledge points
Calculate the interquartile range
Using the Interquartile Range knowledge point
The interquartile range measures statistical dispersion.
Calculate the percentage of students who passed
Using the Cumulative Frequency Curve knowledge point
Find the number of students scoring below \(45\%\) and subtract from the total.

Snap & solve any problem in the app
Get step-by-step solutions on Sovi AI
Photo-based solutions with guided steps
Explore more problems and detailed explanations
Question 1
- Lower Quartile (\(Q_1\)): Approximately \(41.4\%\)
- Median (\(Q_2\)): Approximately \(53.0\%\)
- Upper Quartile (\(Q_3\)): Approximately \(64.5\%\)
Question 2
- Interquartile Range (IQR): Approximately \(23.1\%\)
Question 3
- Percentage of students who passed: Approximately \(67.3\%\)