QUESTION IMAGE
Question
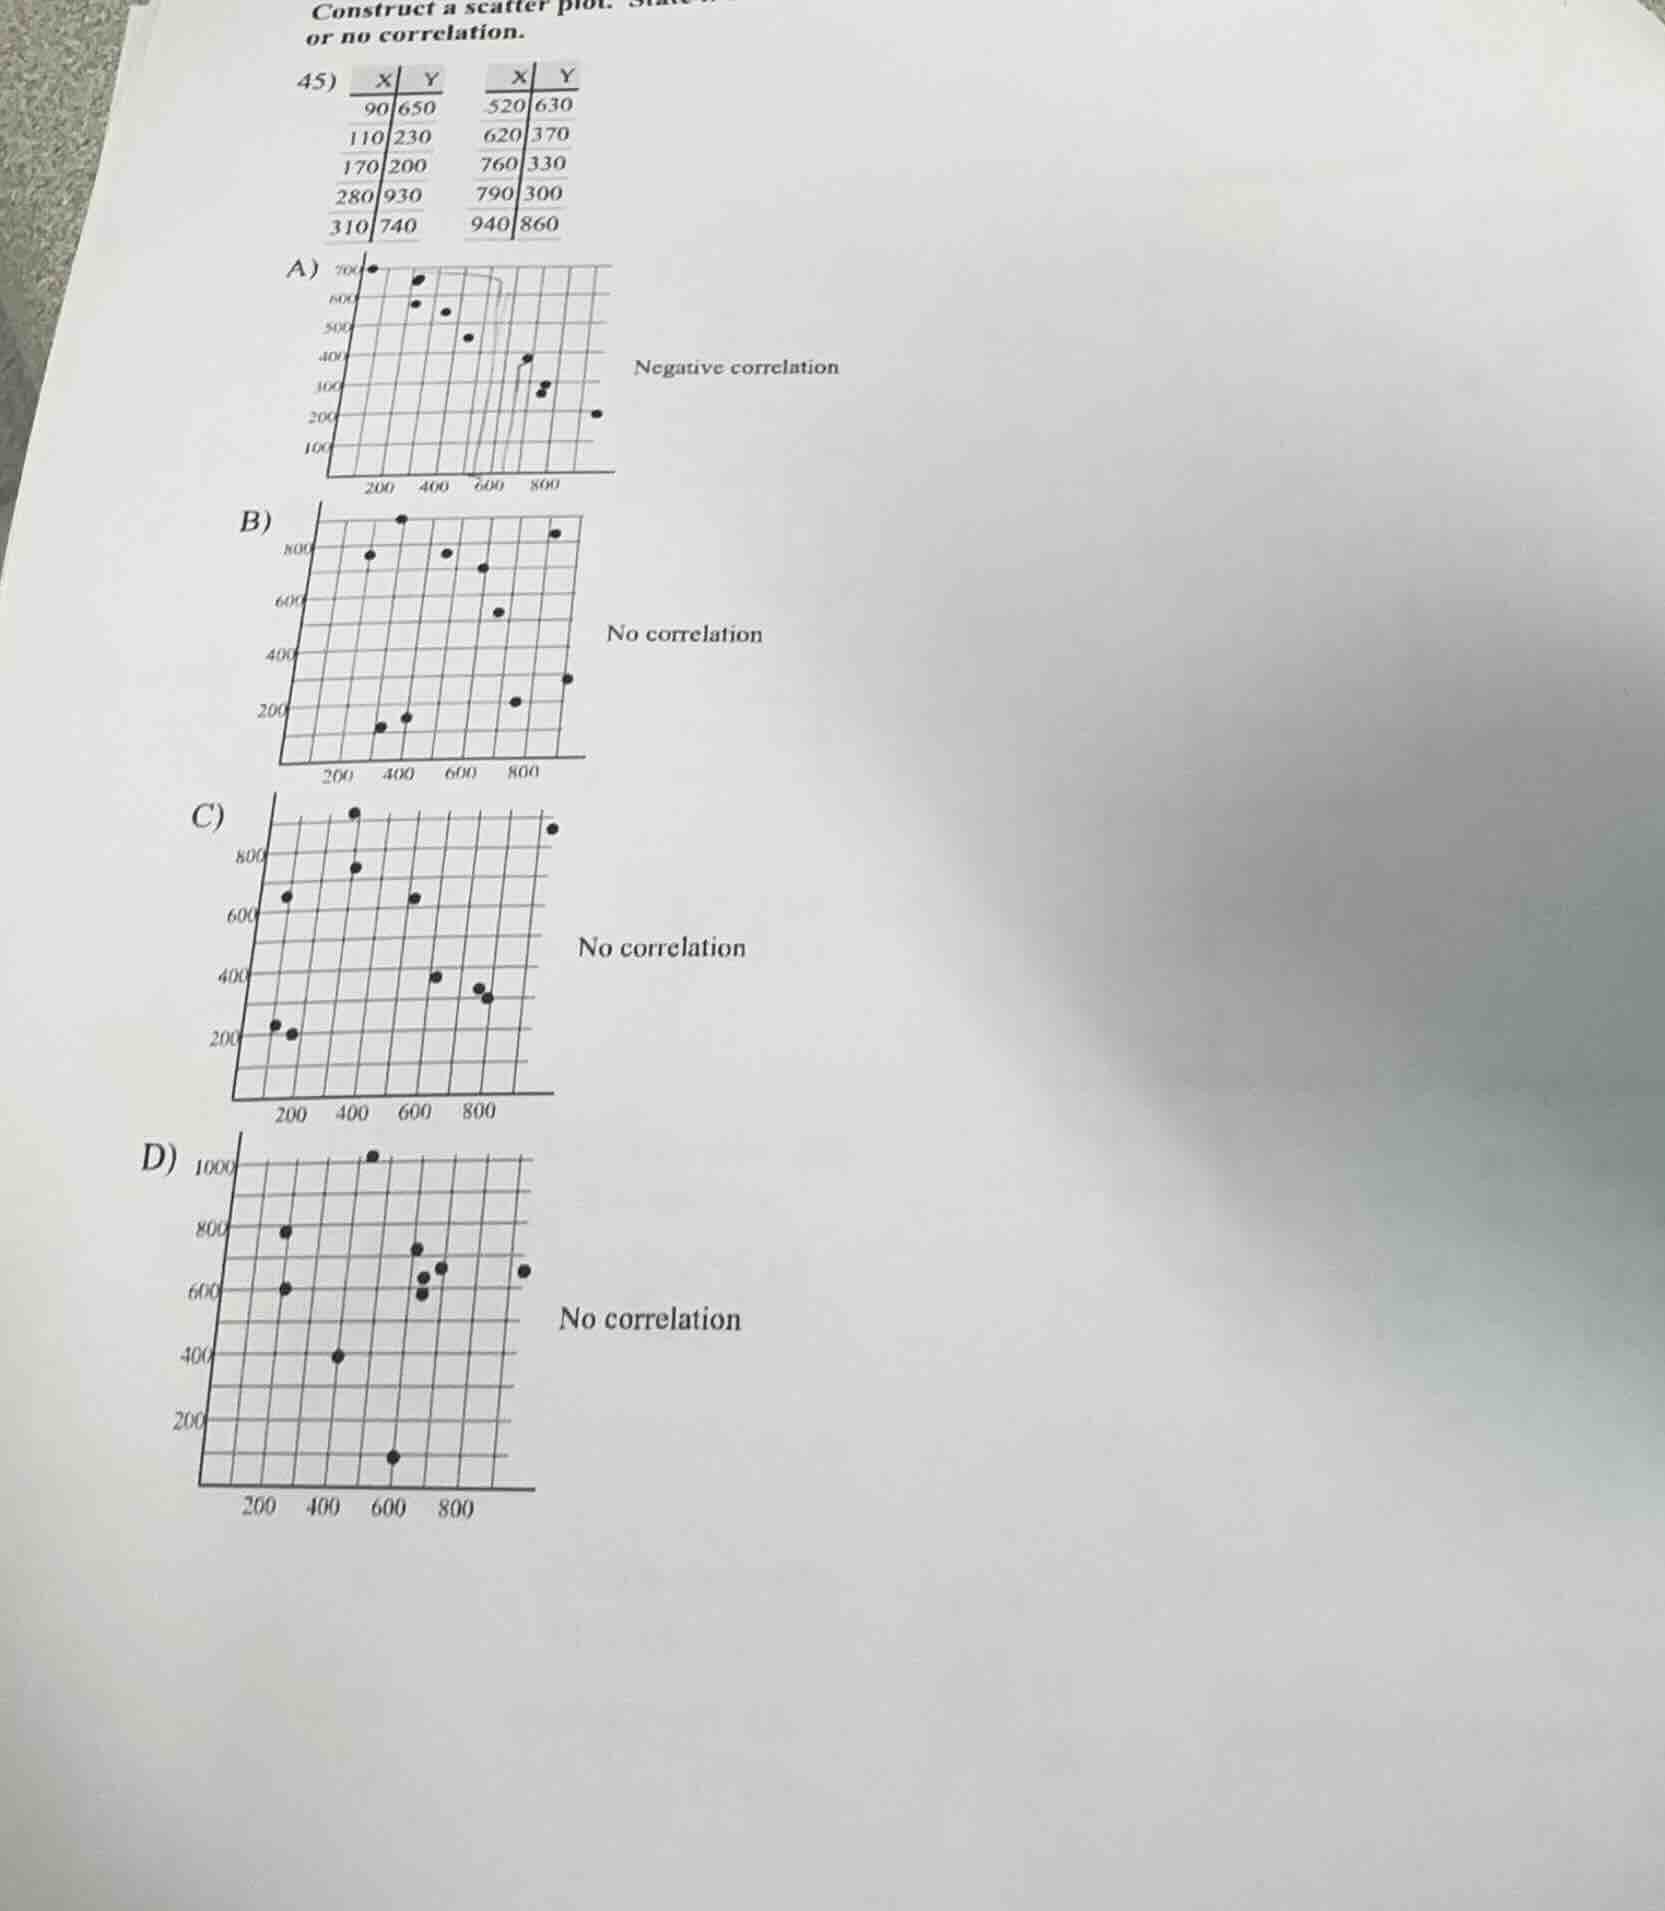
construct a scatter plot. state if there is a positive correlation, negative correlation, or no correlation.
45)
\
$$\begin{tabular}{r|r}
x & y \\\\
\\hline
90 & 650 \\\\
110 & 230 \\\\
170 & 200 \\\\
280 & 930 \\\\
310 & 740
\\end{tabular}$$
\
$$\begin{tabular}{r|r}
x & y \\\\
\\hline
520 & 630 \\\\
620 & 370 \\\\
760 & 330 \\\\
790 & 300 \\\\
940 & 860
\\end{tabular}$$
a) negative correlation
b) no correlation
c) no correlation
d) no correlation
Identify key data points
$$
LATEXBLOCK0
$$
Verify points on option C
$$
LATEXBLOCK1
$$
Determine correlation type
$$
\text{No clear linear trend} \implies \text{No correlation}
$$

Snap & solve any problem in the app
Get step-by-step solutions on Sovi AI
Photo-based solutions with guided steps
Explore more problems and detailed explanations
- (A) Negative correlation graph
- (B) No correlation graph with incorrect points
- (C) No correlation graph with correct points (Correct answer)
- (D) No correlation graph with incorrect points