QUESTION IMAGE
Question
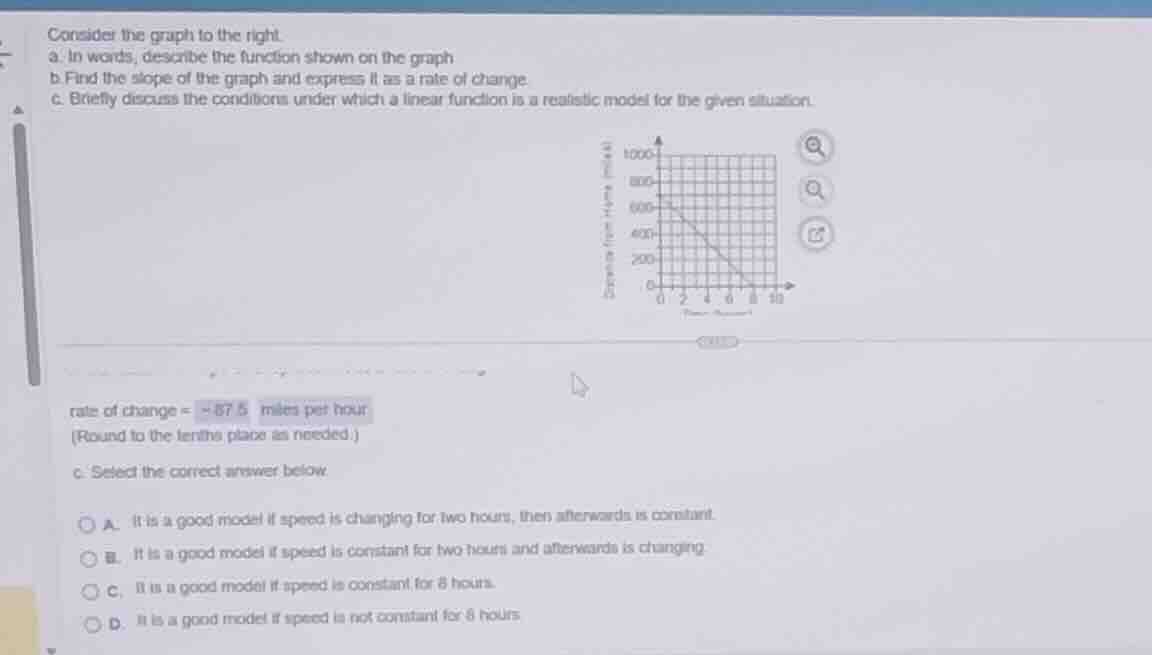
consider the graph to the right.
a. in words, describe the function shown on the graph
b. find the slope of the graph and express it as a rate of change.
c. briefly discuss the conditions under which a linear function is a realistic model for the given situation.
rate of change = \\(-87.5\\) miles per hour
(round to the tenths place as needed.)
c. select the correct answer below.
a. it is a good model if speed is changing for two hours, then afterwards is constant.
b. it is a good model if speed is constant for two hours and afterwards is changing.
c. it is a good model if speed is constant for 8 hours.
d. it is a good model if speed is not constant for 8 hours.
Analyze the graph and situation
Using the Graph Interpretation knowledge point
Interpret the rate of change
Using the Rate of Change Interpretation knowledge point
Evaluate the modeling conditions
For a linear function to model this trip realistically, the rate of change (speed) must remain constant throughout the entire duration of the journey. Since the trip takes 8 hours (from \(x = 0\) to \(x = 8\)), the speed must be constant for these 8 hours.
Select the correct option
Comparing the conditions to the multiple-choice options:
- Option A: Speed changes for two hours, then is constant. (Incorrect)
- Option B: Speed is constant for two hours, then changes. (Incorrect)
- Option C: It is a good model if speed is constant for 8 hours. (Correct)
- Option D: It is a good model if speed is not constant for 8 hours. (Incorrect)

Snap & solve any problem in the app
Get step-by-step solutions on Sovi AI
Photo-based solutions with guided steps
Explore more problems and detailed explanations
- A. It is a good model if speed is changing for two hours, then afterwards is constant.
- B. It is a good model if speed is constant for two hours and afterwards is changing.
- C. It is a good model if speed is constant for 8 hours. (Correct answer)
- D. It is a good model if speed is not constant for 8 hours.