QUESTION IMAGE
Question
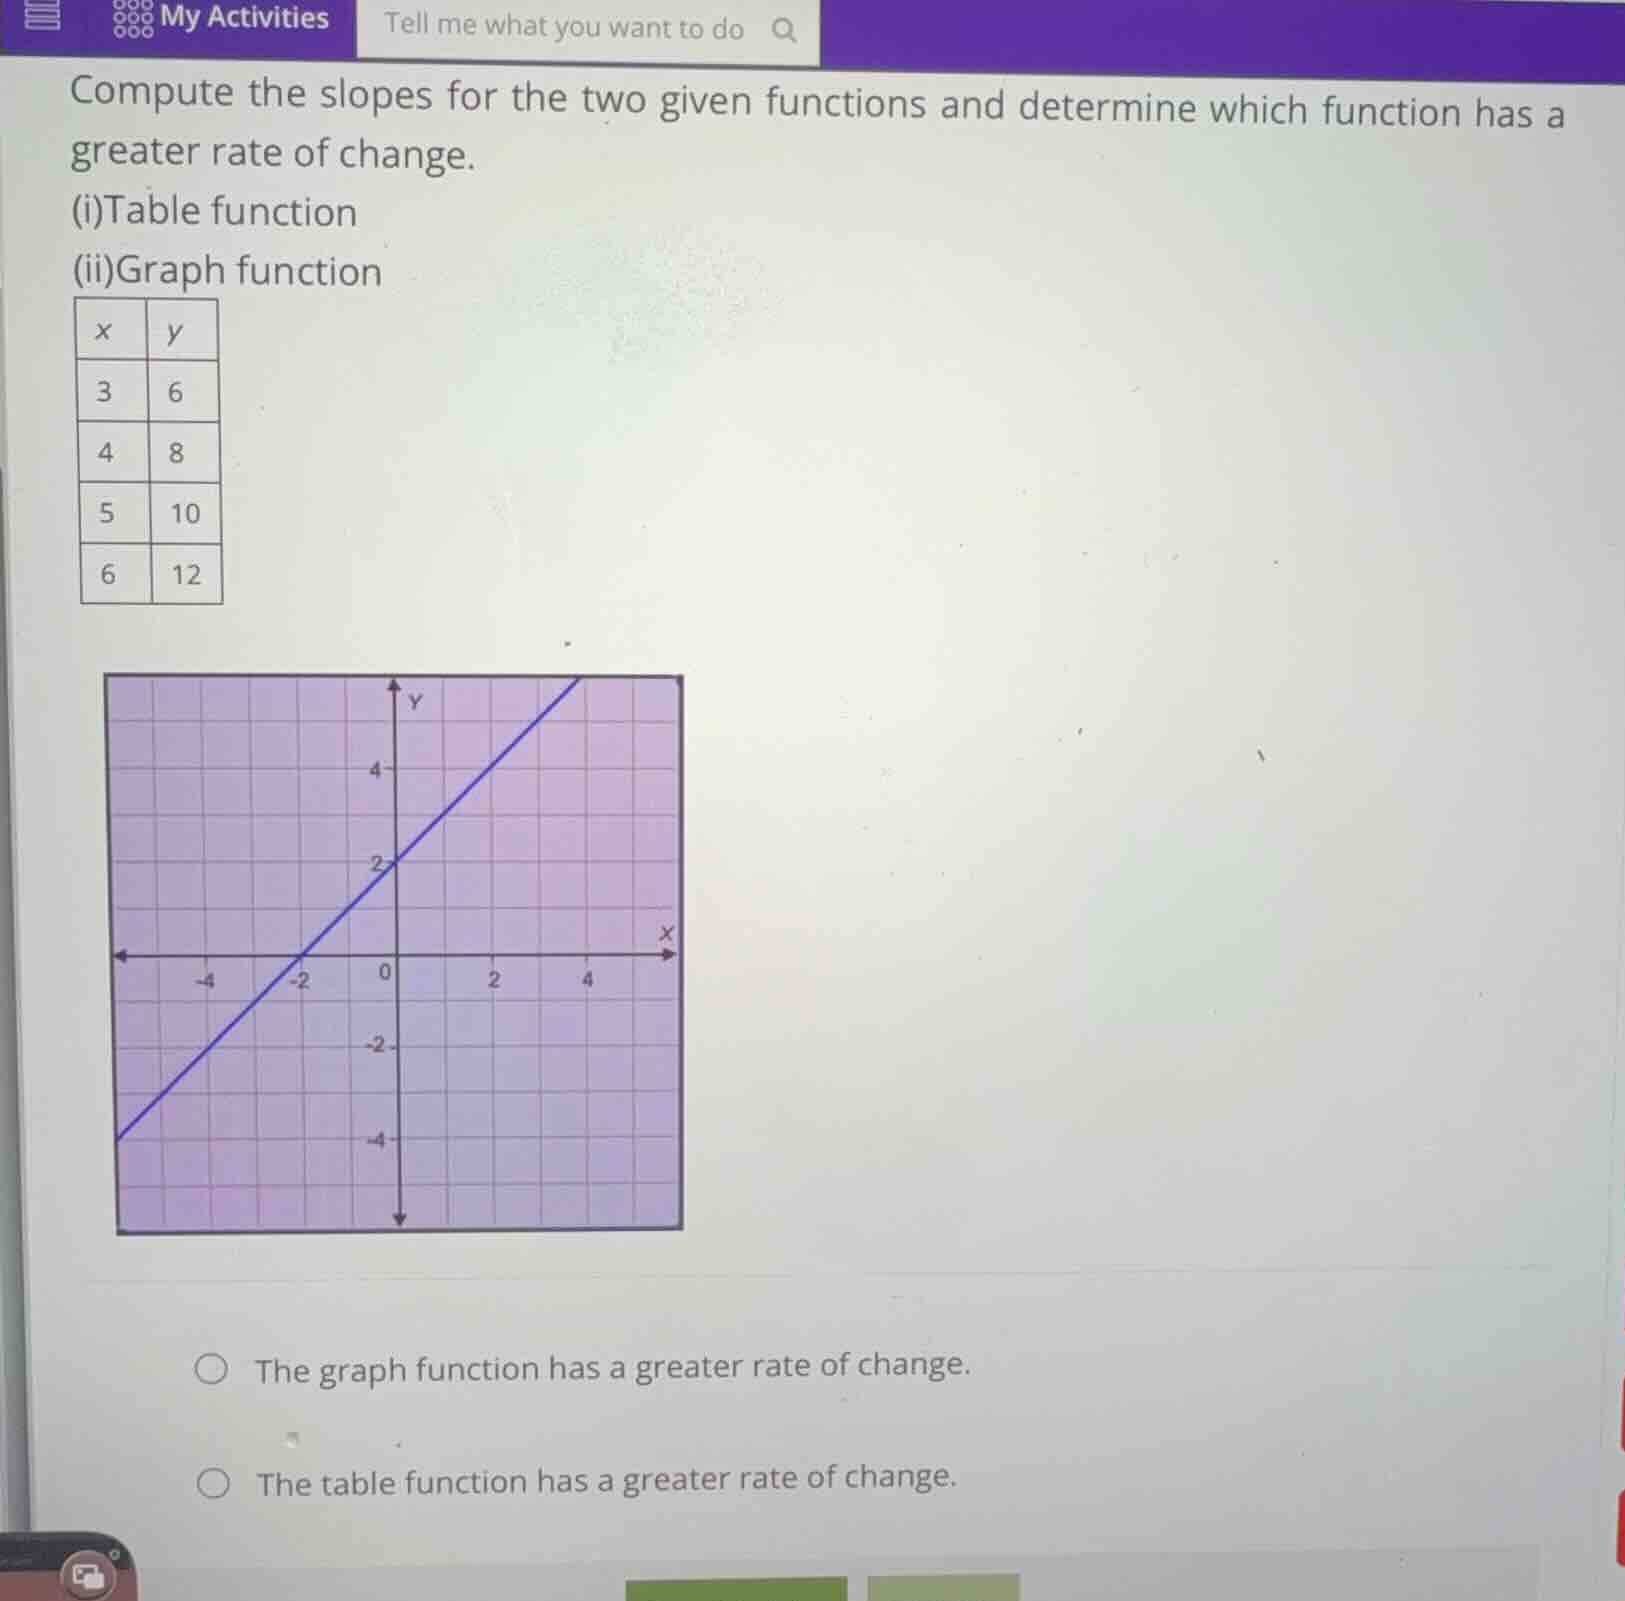
compute the slopes for the two given functions and determine which function has a greater rate of change.
(i)table function
(ii)graph function
\
$$\begin{array}{|c|c|}
\\hline
x & y \\\\
\\hline
3 & 6 \\\\
\\hline
4 & 8 \\\\
\\hline
5 & 10 \\\\
\\hline
6 & 12 \\\\
\\hline
\\end{array}$$
\bigcirc$ the graph function has a greater rate of change.
\bigcirc$ the table function has a greater rate of change.
Calculate the slope of the table function
Using the Slope of a Linear Function knowledge point
$$
m_{\text{table}} = \frac{y_2 - y_1}{x_2 - x_1} = \frac{8 - 6}{4 - 3} = 2
$$
Calculate the slope of the graph function
Using the Slope of a Linear Function knowledge point
$$
LATEXBLOCK0
$$
Compare the rates of change
Using the Rate of Change Comparison knowledge point
$$
LATEXBLOCK1
$$

Snap & solve any problem in the app
Get step-by-step solutions on Sovi AI
Photo-based solutions with guided steps
Explore more problems and detailed explanations
- The graph function has a greater rate of change.
- The table function has a greater rate of change. (Correct answer)