QUESTION IMAGE
Question
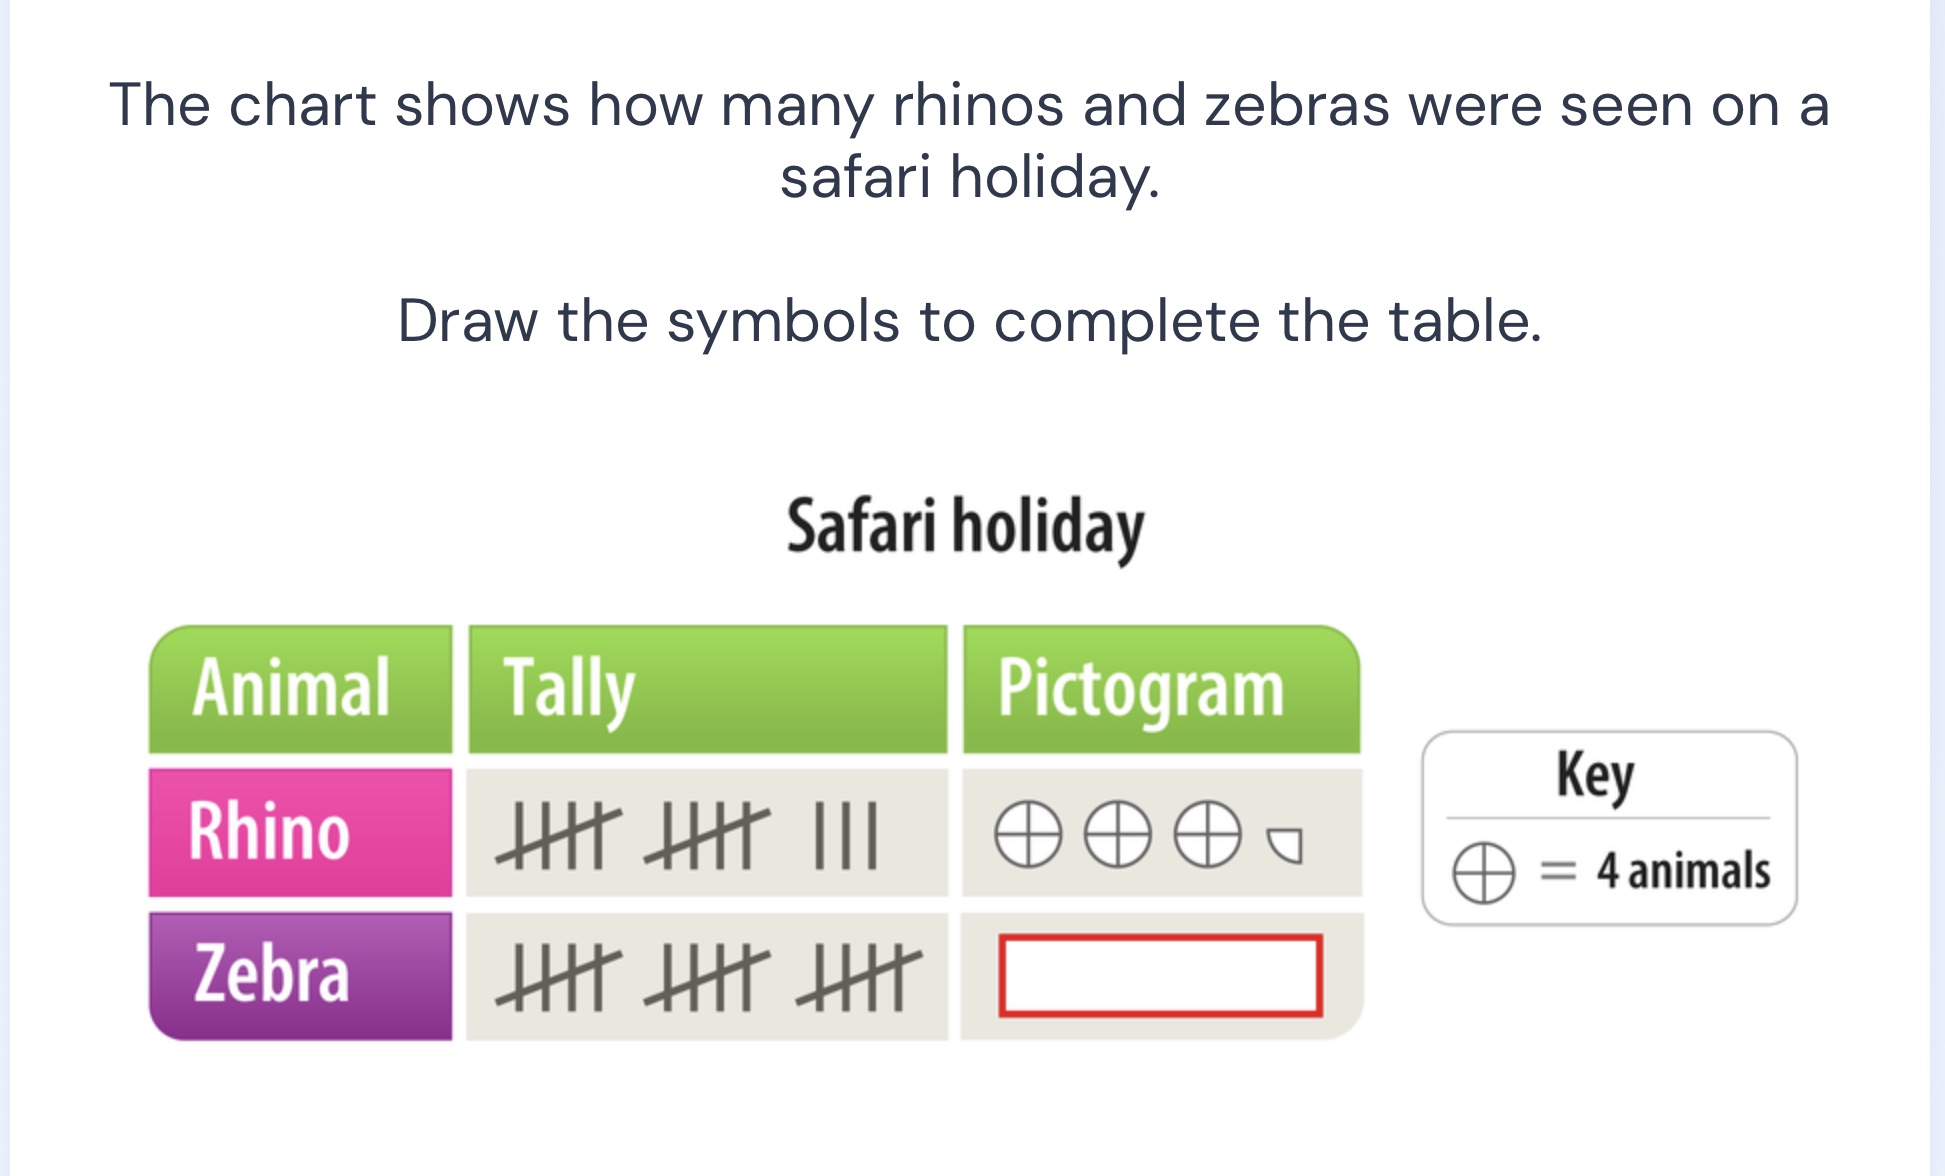
the chart shows how many rhinos and zebras were seen on a safari holiday.
draw the symbols to complete the table.
safari holiday
animal | tally | pictogram
rhino | 13 (shown as two groups of 5 and three single tallies) | three circles with a cross inside and one quarter circle
zebra | 15 (shown as three groups of 5 tallies) | empty box
key:
circle with a cross inside = 4 animals
⚡ Using what you learned: Organizing Data in Tables
Step 1: Count the Zebra Tally
Count the total number of zebras from the tally marks:
- There are three groups of 5 tally marks.
- Total zebras:
Step 2: Determine the Pictogram Symbols
Use the key where each full circle symbol represents 4 animals:
- Divide the total number of zebras by 4:
- This means we need:
- 3 full circle symbols (representing \(3 \times 4 = 12\) animals)
- 1 three-quarter circle symbol (representing the remaining 3 animals)

Snap & solve any problem in the app
Get step-by-step solutions on Sovi AI
Photo-based solutions with guided steps
Explore more problems and detailed explanations
To complete the table for Zebra, you should draw:
- 3 full circles with a cross inside and 1 three-quarter circle (a circle missing its bottom-right quarter).
Represented visually:
$$\oplus\ \oplus\ \oplus\ \ominus$$