QUESTION IMAGE
Question
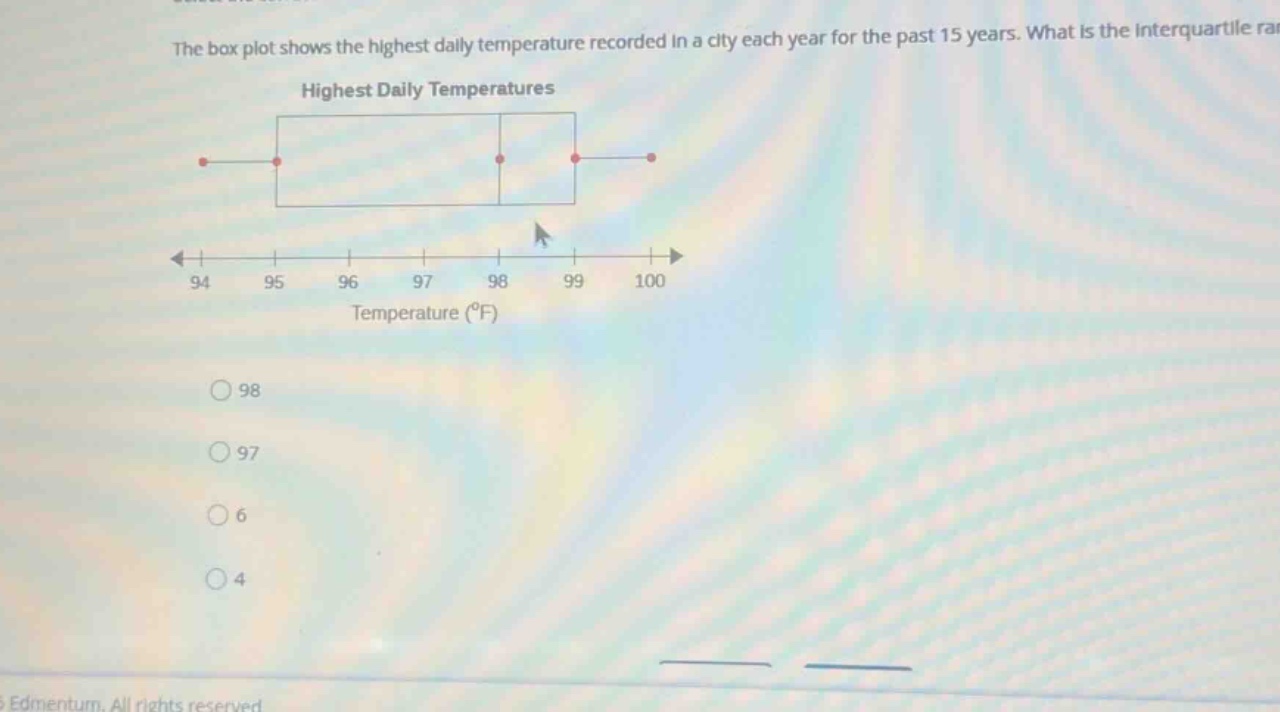
the box plot shows the highest daily temperature recorded in a city each year for the past 15 years. what is the interquartile range?
highest daily temperatures
temperature (\\(^{\circ}\text{f}\\))
98
97
6
4
⚡ Using what you learned: Interquartile Range (IQR)
Step 1: Identify the Quartiles from the Box Plot
From the given box plot:
- The left edge of the box represents the first quartile \( (Q_1) \):
$$ Q_1 = 95 $$
- The right edge of the box represents the third quartile \( (Q_3) \):
$$ Q_3 = 99 $$
Step 2: Calculate the Interquartile Range (IQR)
The formula for the Interquartile Range is:
$$ \text{IQR} = Q_3 - Q_1 $$
Substitute the values:
$$ \text{IQR} = 99 - 95 = 4 $$

Snap & solve any problem in the app
Get step-by-step solutions on Sovi AI
Photo-based solutions with guided steps
Explore more problems and detailed explanations
4