QUESTION IMAGE
Question
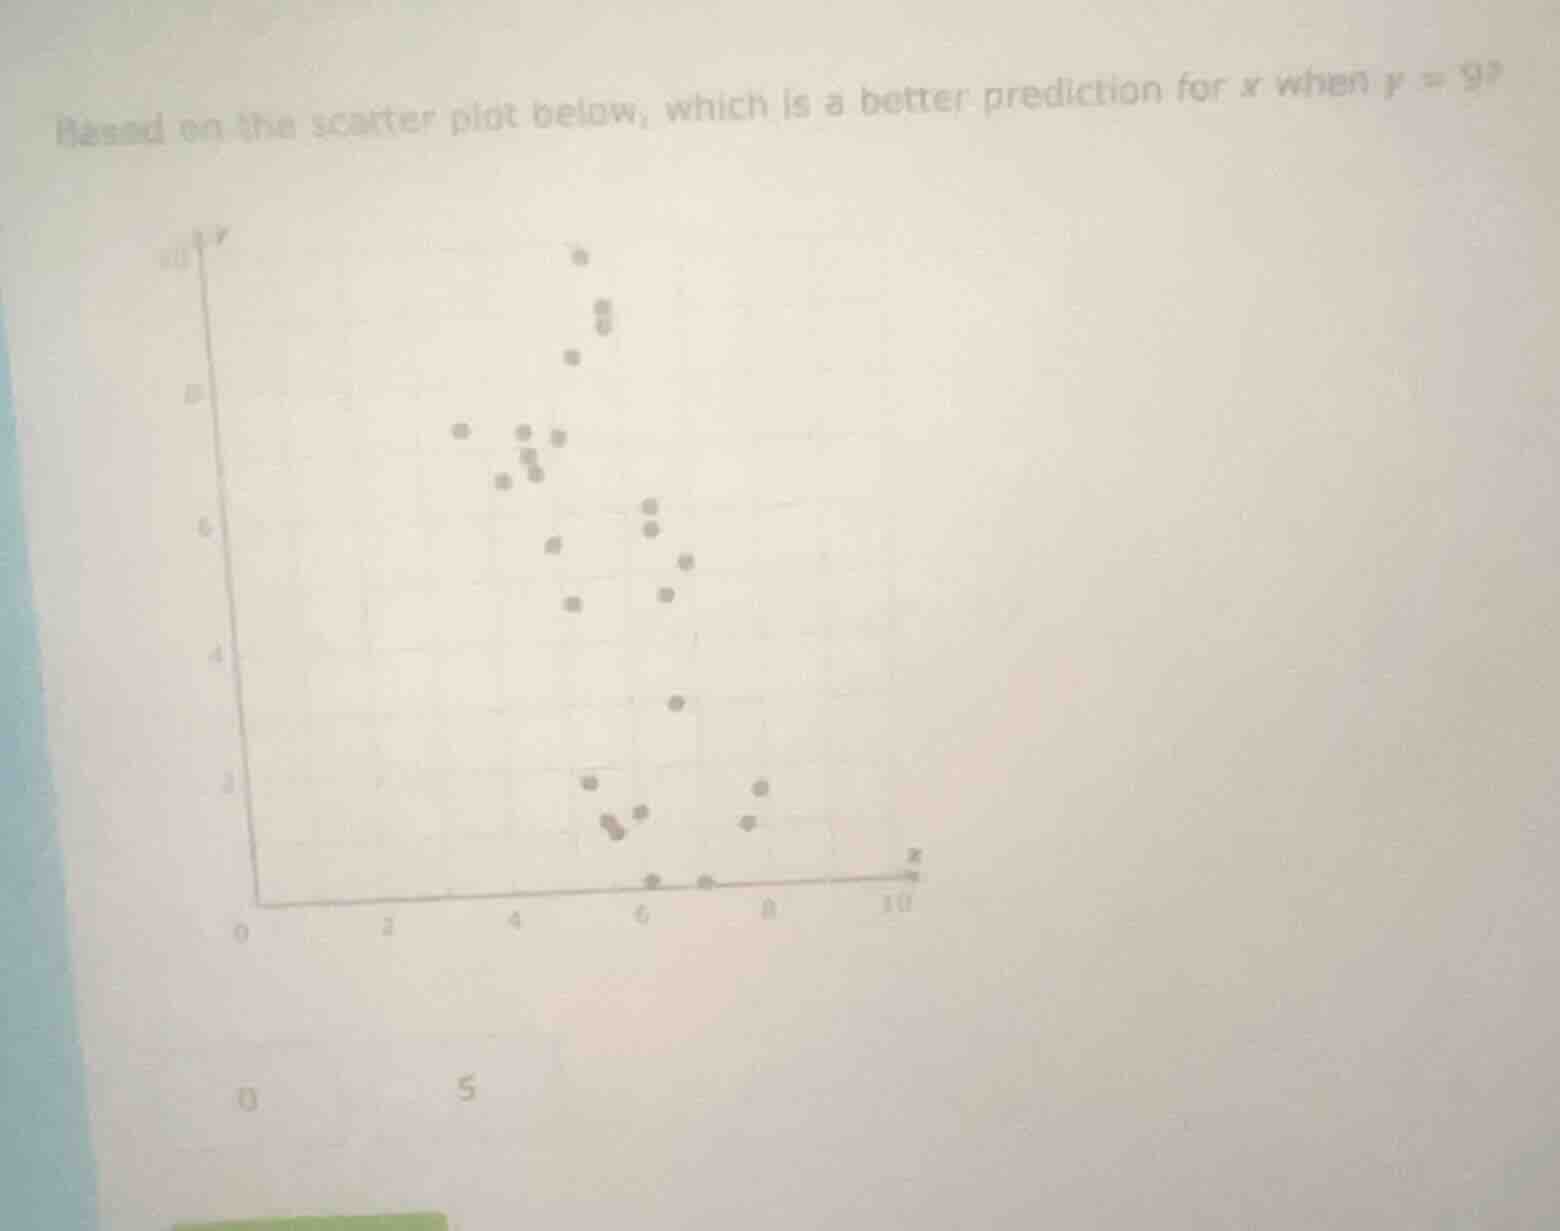
based on the scatter plot below, which is a better prediction for (x) when (y = 9)?
0
5
🆕 New Concept Discovered: Interpreting Scatter Plots
Using data trends to make predictions.
Step 1: Locate the target value on the y-axis
We want to find a prediction for \( x \) when \( y = 9 \).
First, look at the vertical axis (\( y \)-axis) and find the value \( 9 \), which lies halfway between \( 8 \) and \( 10 \).
Step 2: Analyze the data points near this level
Look horizontally across the grid at the level where \( y = 9 \):
- There is a cluster of data points around this height.
- These points are positioned horizontally above the \( x \)-axis values.
- Looking down from these points to the horizontal axis (\( x \)-axis), they align closely with \( x = 5 \).
- There are no data points near \( x = 0 \) at this height.
Step 3: Compare the given choices
We are given two choices at the bottom of the image:
- \( 0 \)
- \( 5 \)
Since the points at the height of \( y = 9 \) are clustered around \( x = 5 \), \( 5 \) is the much better prediction.

Snap & solve any problem in the app
Get step-by-step solutions on Sovi AI
Photo-based solutions with guided steps
Explore more problems and detailed explanations
5