QUESTION IMAGE
Question
assume that a hat contains four bills: a \\$2 bill, a \\$10 bill, a \\$50 bill, and a \\$100 bill. each bill is equally likely to be selected. two bills are to be selected at random with replacement. construct a sample space and determine the probability that both bills are \\$50 bills.
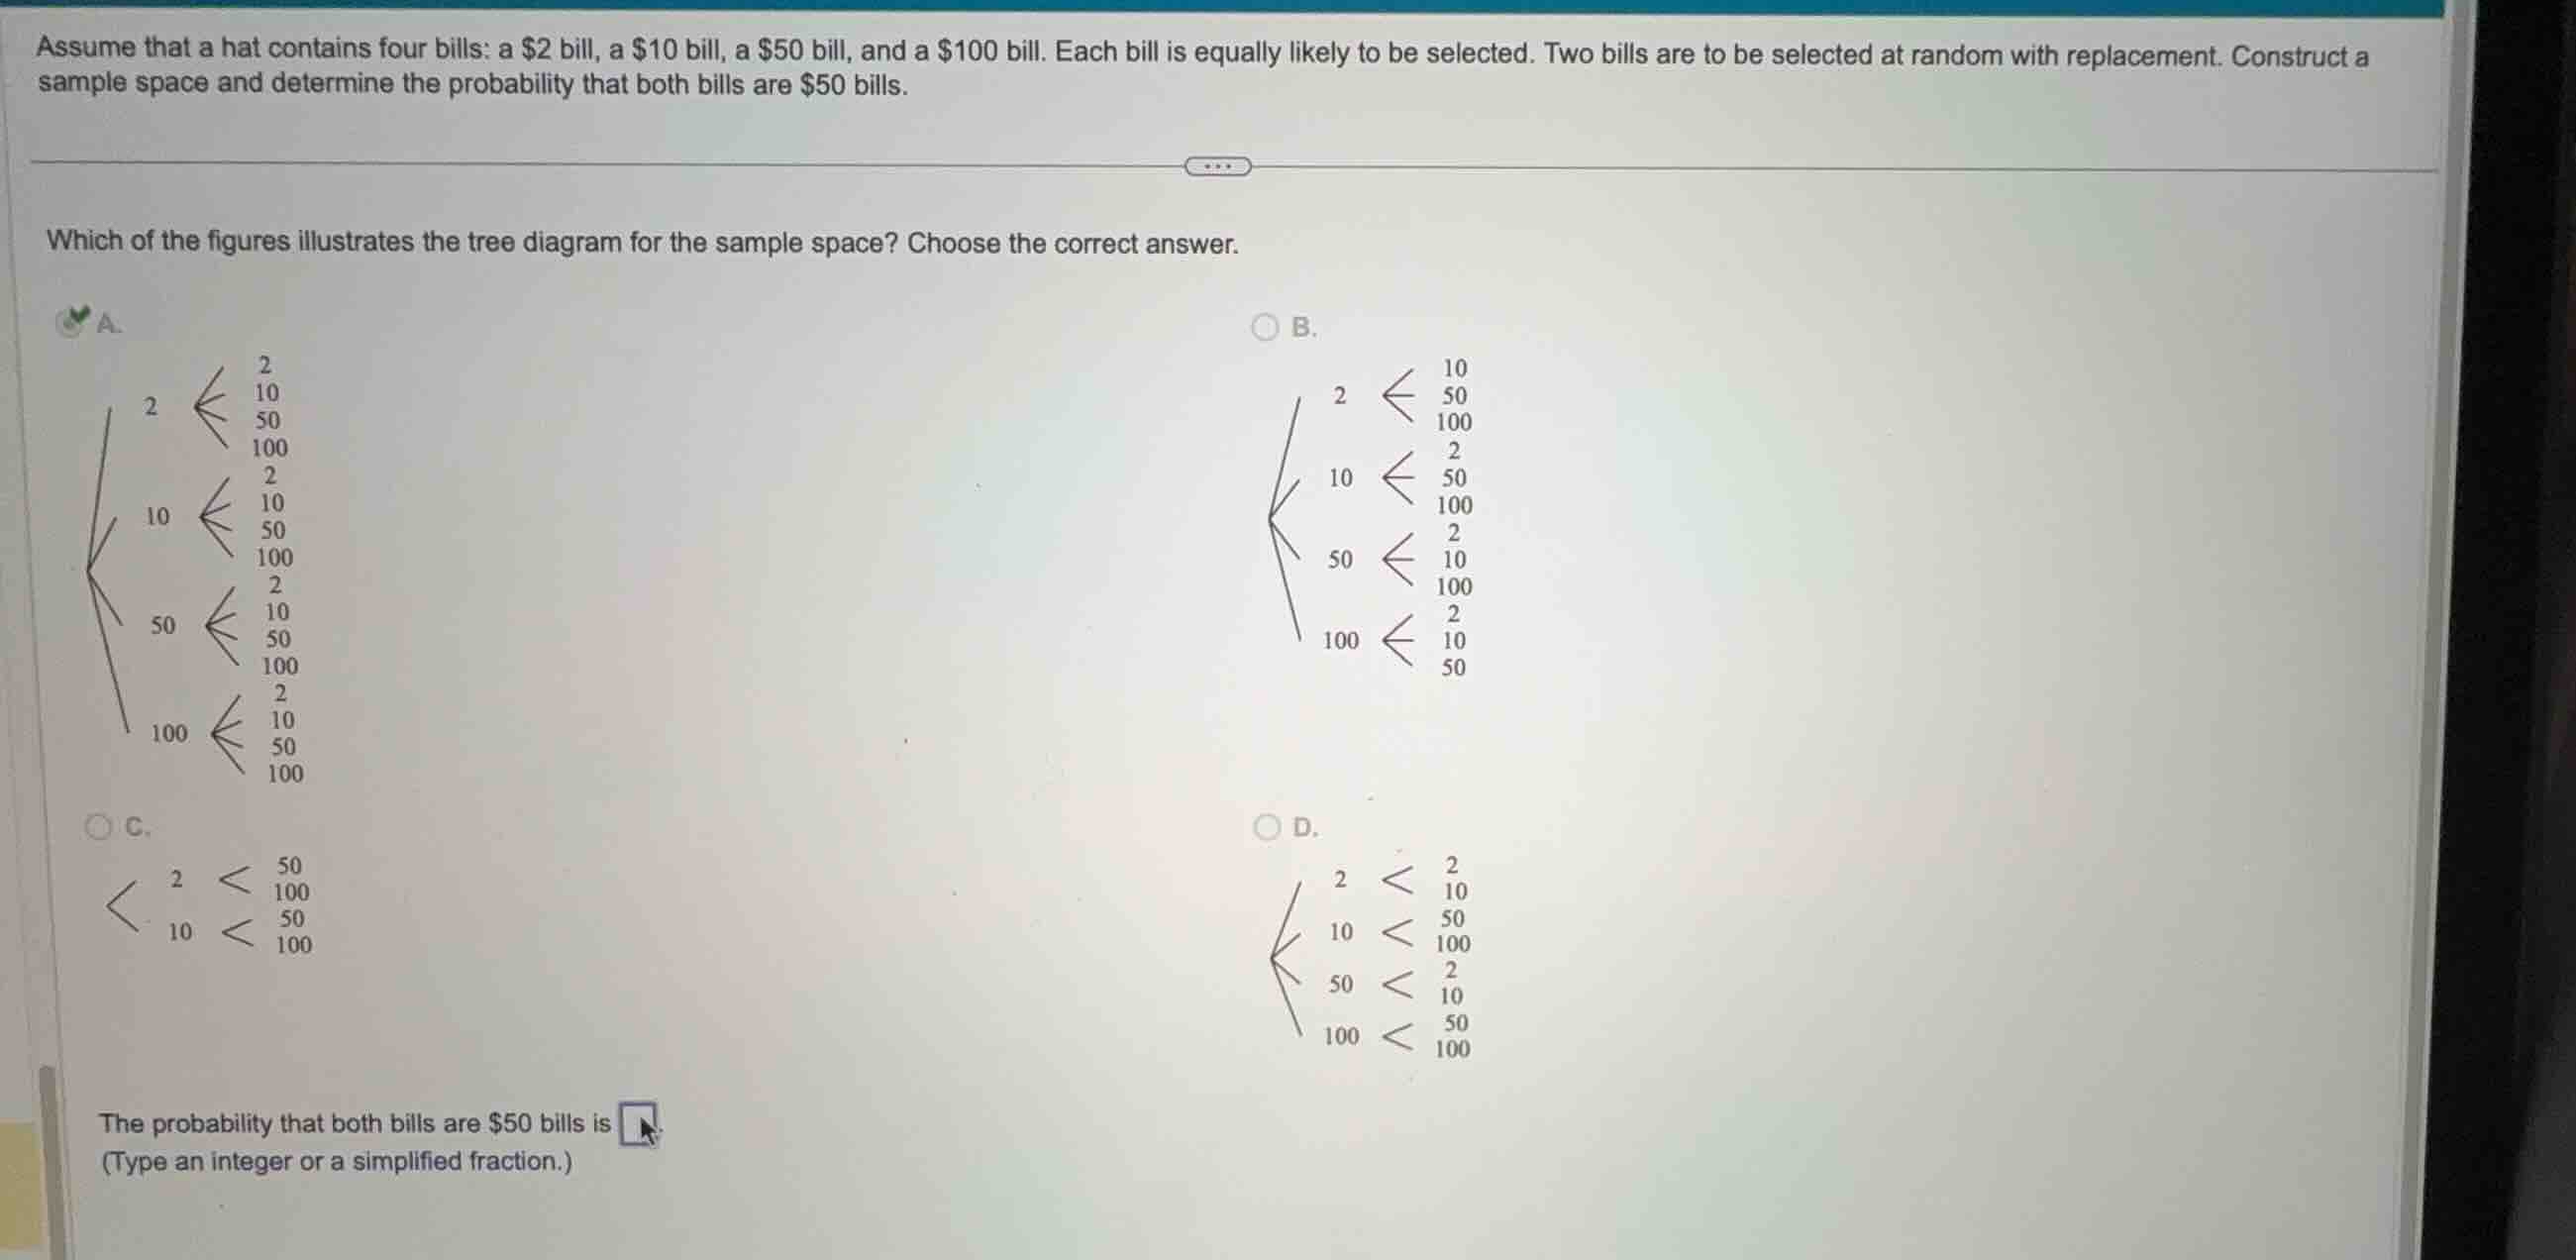
which of the figures illustrates the tree diagram for the sample space? choose the correct answer.
the probability that both bills are \\$50 bills is
(type an integer or a simplified fraction.)
Identify the sample space structure
Using the Tree Diagrams and Sample Space Construction knowledge points
- First selection options: \(2, 10, 50, 100\)
- Since selection is with replacement, the second selection options for each branch are also: \(2, 10, 50, 100\)
- This yields \(4 \times 4 = 16\) outcomes.
- Diagram A shows 4 main branches, each splitting into 4 sub-branches: \(2, 10, 50, 100\).
- Therefore, Diagram A is the correct tree diagram.
Calculate the probability of selecting two $50 bills
Using the Theoretical Probability knowledge point
- Total outcomes in sample space: \(N = 16\)
- Favorable outcome: \((50, 50)\)
- Number of favorable outcomes: \(n = 1\)
- Probability:

Snap & solve any problem in the app
Get step-by-step solutions on Sovi AI
Photo-based solutions with guided steps
Explore more problems and detailed explanations
Question 1
- A. The tree diagram showing 4 initial branches (2, 10, 50, 100), each splitting into 4 identical sub-branches (2, 10, 50, 100). (Correct answer)
- B. The tree diagram showing 4 initial branches, each splitting into only 3 sub-branches (representing selection without replacement).
- C. The tree diagram showing only 2 initial branches.
- D. The tree diagram showing 4 initial branches, each splitting into only 2 sub-branches.
Question 2
The probability that both bills are $50 bills is <blank>\(\frac{1}{16}\)</blank>