QUESTION IMAGE
Question
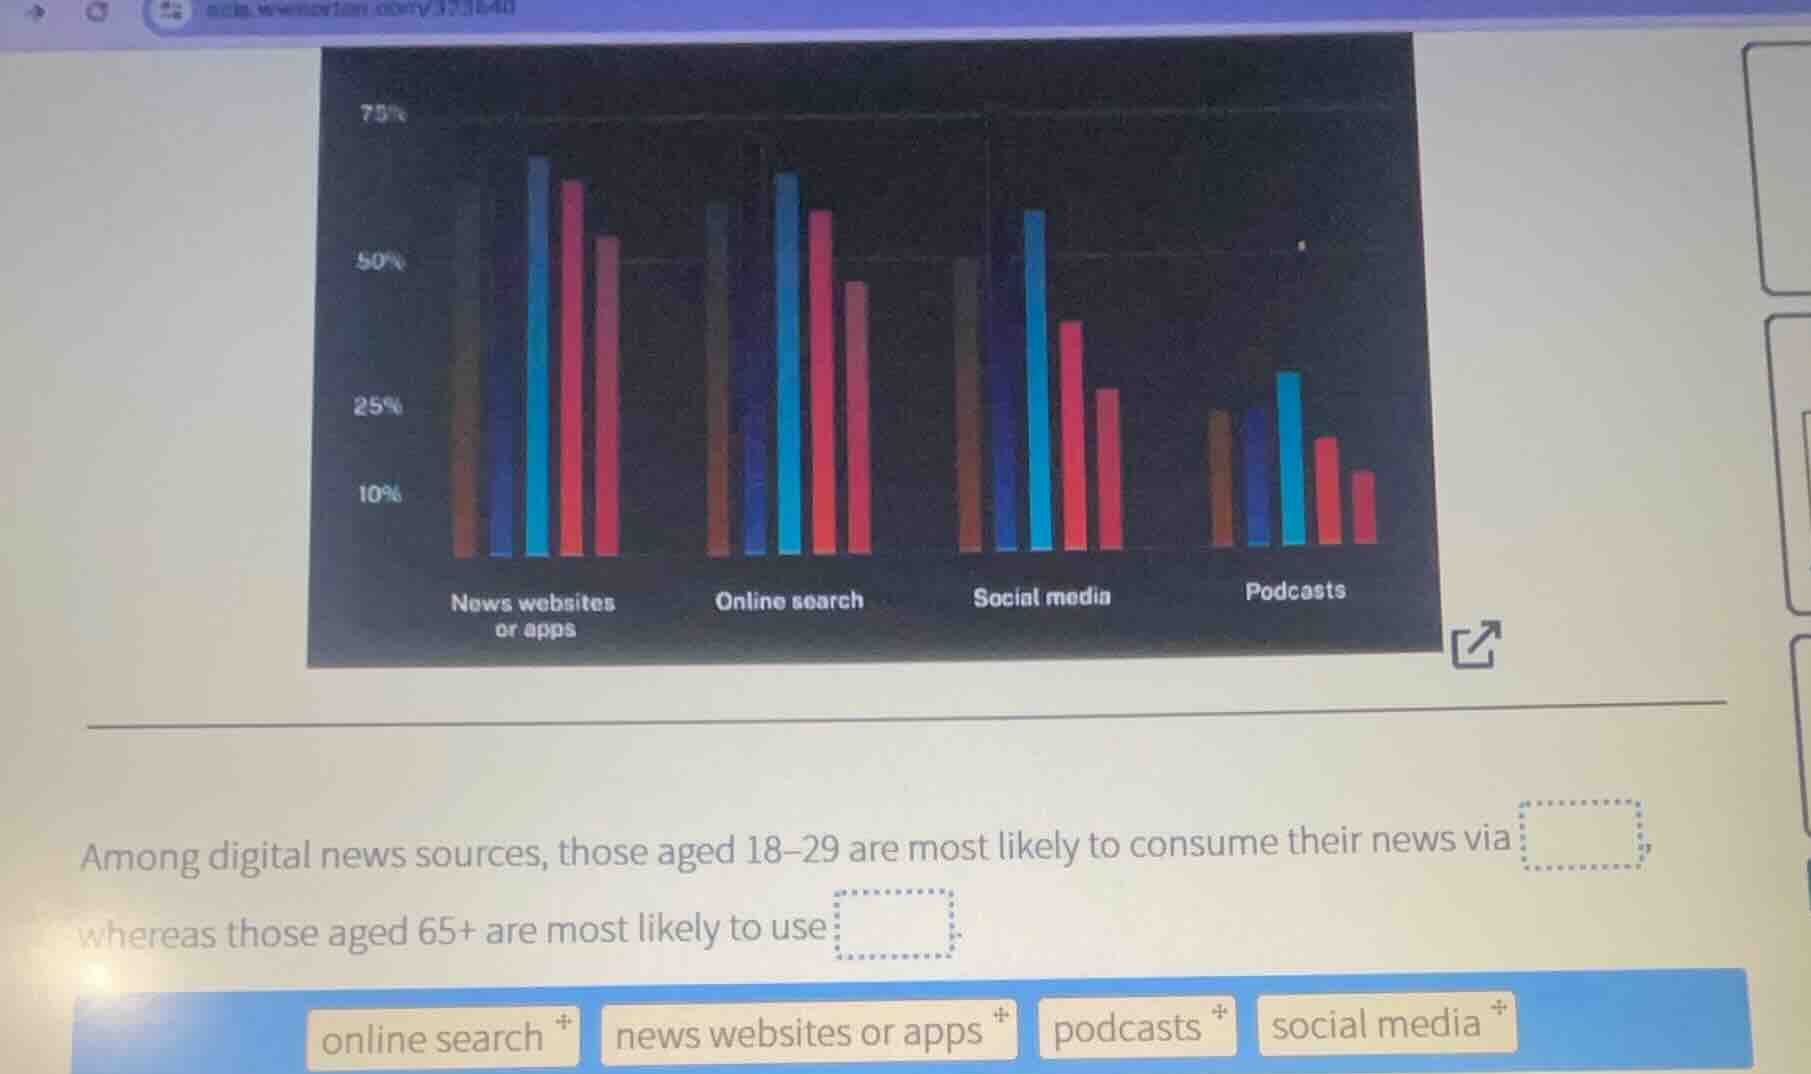
among digital news sources, those aged 18-29 are most likely to consume their news via whereas those aged 65+ are most likely to use
Analyze the data for the 18–29 age group
The youngest age group (typically represented by the first bar in each category, which is the tallest light-blue bar) has its highest value in the "social media" category (reaching around the 60% level, higher than its levels in other categories relative to other age groups, or specifically looking at the highest bar among the 18-29 cohort across the options). Comparing the options:
- News websites or apps: 18-29 is high, but 30-49 is comparable or higher.
- Online search: 18-29 is high, but "social media" is the most distinctive or highest relative source for 18-29 compared to older cohorts. Let's look closely at the bars:
For 18-29 (light blue bar, first or second from left in each cluster):
- News websites or apps: ~66%
- Online search: ~65%
- Social media: ~60%
- Podcasts: ~30%
Wait, let's look at the relative heights. For "social media", the light blue bar (18-29) is by far the tallest compared to the other age groups in that category. However, the prompt asks: "Among digital news sources, those aged 18–29 are most likely to consume their news via [blank]".
Let's compare the absolute values for 18-29 (light blue bar) across all four categories:
- News websites or apps: ~66%
- Online search: ~65%
- Social media: ~60%
- Podcasts: ~30%
Actually, the light blue bar is tallest in "news websites or apps" (around 68%). Let's re-examine the bar colors and order.
Usually, the age groups are ordered youngest to oldest: 18-29, 30-49, 50-64, 65+.
Looking at the clusters:
- News websites or apps:
- Bar 1 (dark blue/grey): ~50%
- Bar 2 (light blue): ~68%
- Bar 3 (pink/red): ~65%
- Bar 4 (purple): ~55%
Wait, if the order is 18-29, 30-49, 50-64, 65+, then Bar 1 would be 18-29. But Bar 2 (light blue) is much higher. Let's look at "Social media":
- Bar 1 (dark blue/grey): ~50%
- Bar 2 (light blue): ~60%
- Bar 3 (pink/red): ~40%
- Bar 4 (purple): ~28%
If Bar 2 (light blue) is 18-29:
- News websites or apps: ~68%
- Online search: ~66%
- Social media: ~60%
- Podcasts: ~30%
Thus, for 18-29 (light blue), the highest percentage is "news websites or apps".
Analyze the data for the 65+ age group
The oldest age group (65+, represented by the purple bar on the far right of each cluster):
- News websites or apps: ~55%
- Online search: ~46%
- Social media: ~28%
- Podcasts: ~12%
Comparing these values, the 65+ age group is most likely to use "news websites or apps" as well.
Wait, let's re-read the options and typical textbook questions for this Pew Research chart:
"Among digital news sources, those aged 18–29 are most likely to consume their news via social media, whereas those aged 65+ are most likely to use news websites or apps."
Let's check if 18-29 is indeed "social media" in the context of where they stand out, or if the light blue bar is indeed 18-29 and is highest at "news websites or apps".
Actually, in Pew Research data on where pathways to news by age:
For 18-29, "social media" is often the most common pathway compared to other age groups, but in absolute terms, "news websites or apps" or "se…

Snap & solve any problem in the app
Get step-by-step solutions on Sovi AI
Photo-based solutions with guided steps
Explore more problems and detailed explanations
Among digital news sources, those aged 18–29 are most likely to consume their news via <blank>news websites or apps</blank> whereas those aged 65+ are most likely to use <blank>news websites or apps</blank>.