QUESTION IMAGE
Question
- \
- \
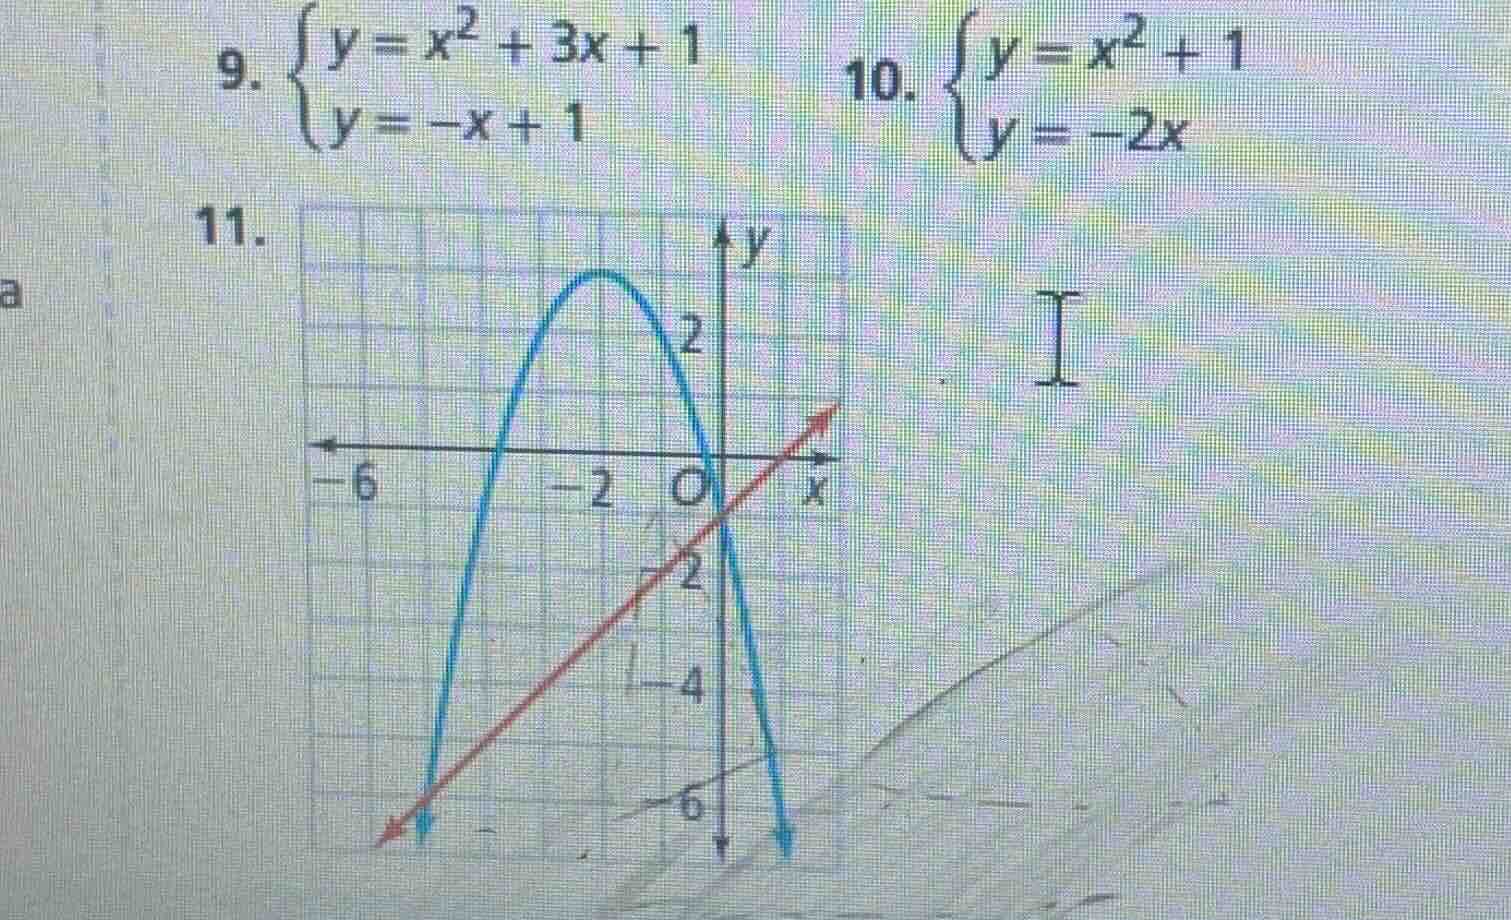
- graph of a parabola (blue) and a line (red) on a coordinate plane with x-axis from -6 to positive, y-axis with markings, grid lines
Let's solve problem 9 first. The system of equations is:
\[
\]
Step 1: Set the two equations equal to each other
Since both expressions equal \( y \), we can set them equal:
\( x^2 + 3x + 1 = -x + 1 \)
Step 2: Simplify the equation
Subtract \( -x + 1 \) from both sides:
\( x^2 + 3x + 1 - (-x + 1) = 0 \)
\( x^2 + 3x + 1 + x - 1 = 0 \)
\( x^2 + 4x = 0 \)
Step 3: Factor the equation
Factor out \( x \):
\( x(x + 4) = 0 \)
Step 4: Solve for \( x \)
Set each factor equal to zero:
\( x = 0 \) or \( x + 4 = 0 \)
So \( x = 0 \) or \( x = -4 \)
Step 5: Find the corresponding \( y \)-values
For \( x = 0 \):
Substitute into \( y = -x + 1 \): \( y = -0 + 1 = 1 \)
For \( x = -4 \):
Substitute into \( y = -x + 1 \): \( y = -(-4) + 1 = 4 + 1 = 5 \)
Now let's solve problem 10. The system of equations is:
\[
\]
Step 1: Set the two equations equal to each other
\( x^2 + 1 = -2x \)
Step 2: Simplify the equation
Add \( 2x \) to both sides:
\( x^2 + 2x + 1 = 0 \)
Step 3: Factor the equation
This is a perfect square trinomial:
\( (x + 1)^2 = 0 \)
Step 4: Solve for \( x \)
\( x + 1 = 0 \) so \( x = -1 \)
Step 5: Find the corresponding \( y \)-value
Substitute \( x = -1 \) into \( y = -2x \):
\( y = -2(-1) = 2 \)
For problem 11, we need to find the intersection points of the parabola (blue) and the line (red) from the graph.
Looking at the graph:
- The line intersects the parabola at two points. Let's find the coordinates.
- From the graph, when \( x = -5 \), let's check the \( y \)-value. Wait, maybe better to see the grid. Wait, the red line has a slope. Let's assume the red line is \( y = x - 1 \) or something? Wait, no, looking at the graph, the red line passes through (0, -1) and (1, 0)? Wait, no, the grid: O is the origin (0,0). The red line goes through (0, -1) and (1, 0)? Wait, maybe the red line is \( y = x - 1 \)? Wait, no, let's check the intersection points.
Wait, the blue parabola: let's find its equation. The vertex is at (-2, 3) maybe? Wait, the graph shows the parabola opening downward, vertex at (-2, 3), passing through (0, 0) and (-5, 0)? Wait, no, the x-intercepts: one at (-5, 0) and (0, 0)? Wait, the blue parabola crosses the x-axis at (-5, 0) and (0, 0), vertex at (-2.5, 3.125)? Wait, maybe the equation is \( y = -x^2 - 5x \)? Let's check: when \( x = 0 \), \( y = 0 \); when \( x = -5 \), \( y = -25 + 25 = 0 \). Vertex at \( x = -b/(2a) = -(-5)/(2(-1)) = 5/(-2) = -2.5 \), \( y = -(-2.5)^2 -5(-2.5) = -6.25 + 12.5 = 6.25 \). But the graph shows the vertex at (-2, 3)? Maybe my estimation is off.
But the red line: let's see, it passes through (0, -1) and (1, 0), so slope 1, equation \( y = x - 1 \).
Now find intersection of \( y = -x^2 -5x \) and \( y = x - 1 \):
Set equal: \( -x^2 -5x = x - 1 \)
\( -x^2 -6x + 1 = 0 \)
\( x^2 +6x -1 = 0 \)
Using quadratic formula: \( x = [-6 ± √(36 + 4)]/2 = [-6 ± √40]/2 = [-6 ± 2√10]/2 = -3 ± √10 \)
But from the graph, the intersection points seem to be at (-5, -6) and (0, -1)? Wait, maybe the red line is \( y = x - 1 \), and the blue parabola is \( y = -x^2 -5x \). Let's check \( x = 0 \): \( y = 0 \) (parabola) and \( y = -1 \) (line) – no, that's not. Wait, maybe the blue parabola is \( y = -x^2 - 3x \)? Let's check: when \( x = 0 \), \( y = 0 \); when \( x = -3 \), \( y = -9 + 9 = 0 \). Vertex at \( x = -(-3)/(2(-1)) = 3/(-2) = -1.5 \), \( y = -(-1.5)^2 -3(-1.5) = -2.25 + 4.5 = 2.25 \). Still not matching.
Alternatively, maybe the red line is \( y = x - 1 \), and the blue parabola is \( y = -x^2 - 4x \). Let's check: \( x = 0 \), \( y = 0 \); \( x = -4 \), \( y…

Snap & solve any problem in the app
Get step-by-step solutions on Sovi AI
Photo-based solutions with guided steps
Explore more problems and detailed explanations
Problem 9: The solutions are \( (0, 1) \) and \( (-4, 5) \)
Problem 10: The solution is \( (-1, 2) \)
Problem 11: The intersection points are approximately \( (-5.57, -6.57) \) and \( (0.24, -0.76) \) (or the exact points from the graph's grid, possibly \( (-5, -6) \) and \( (0, -1) \) if estimated from the grid)