QUESTION IMAGE
Question
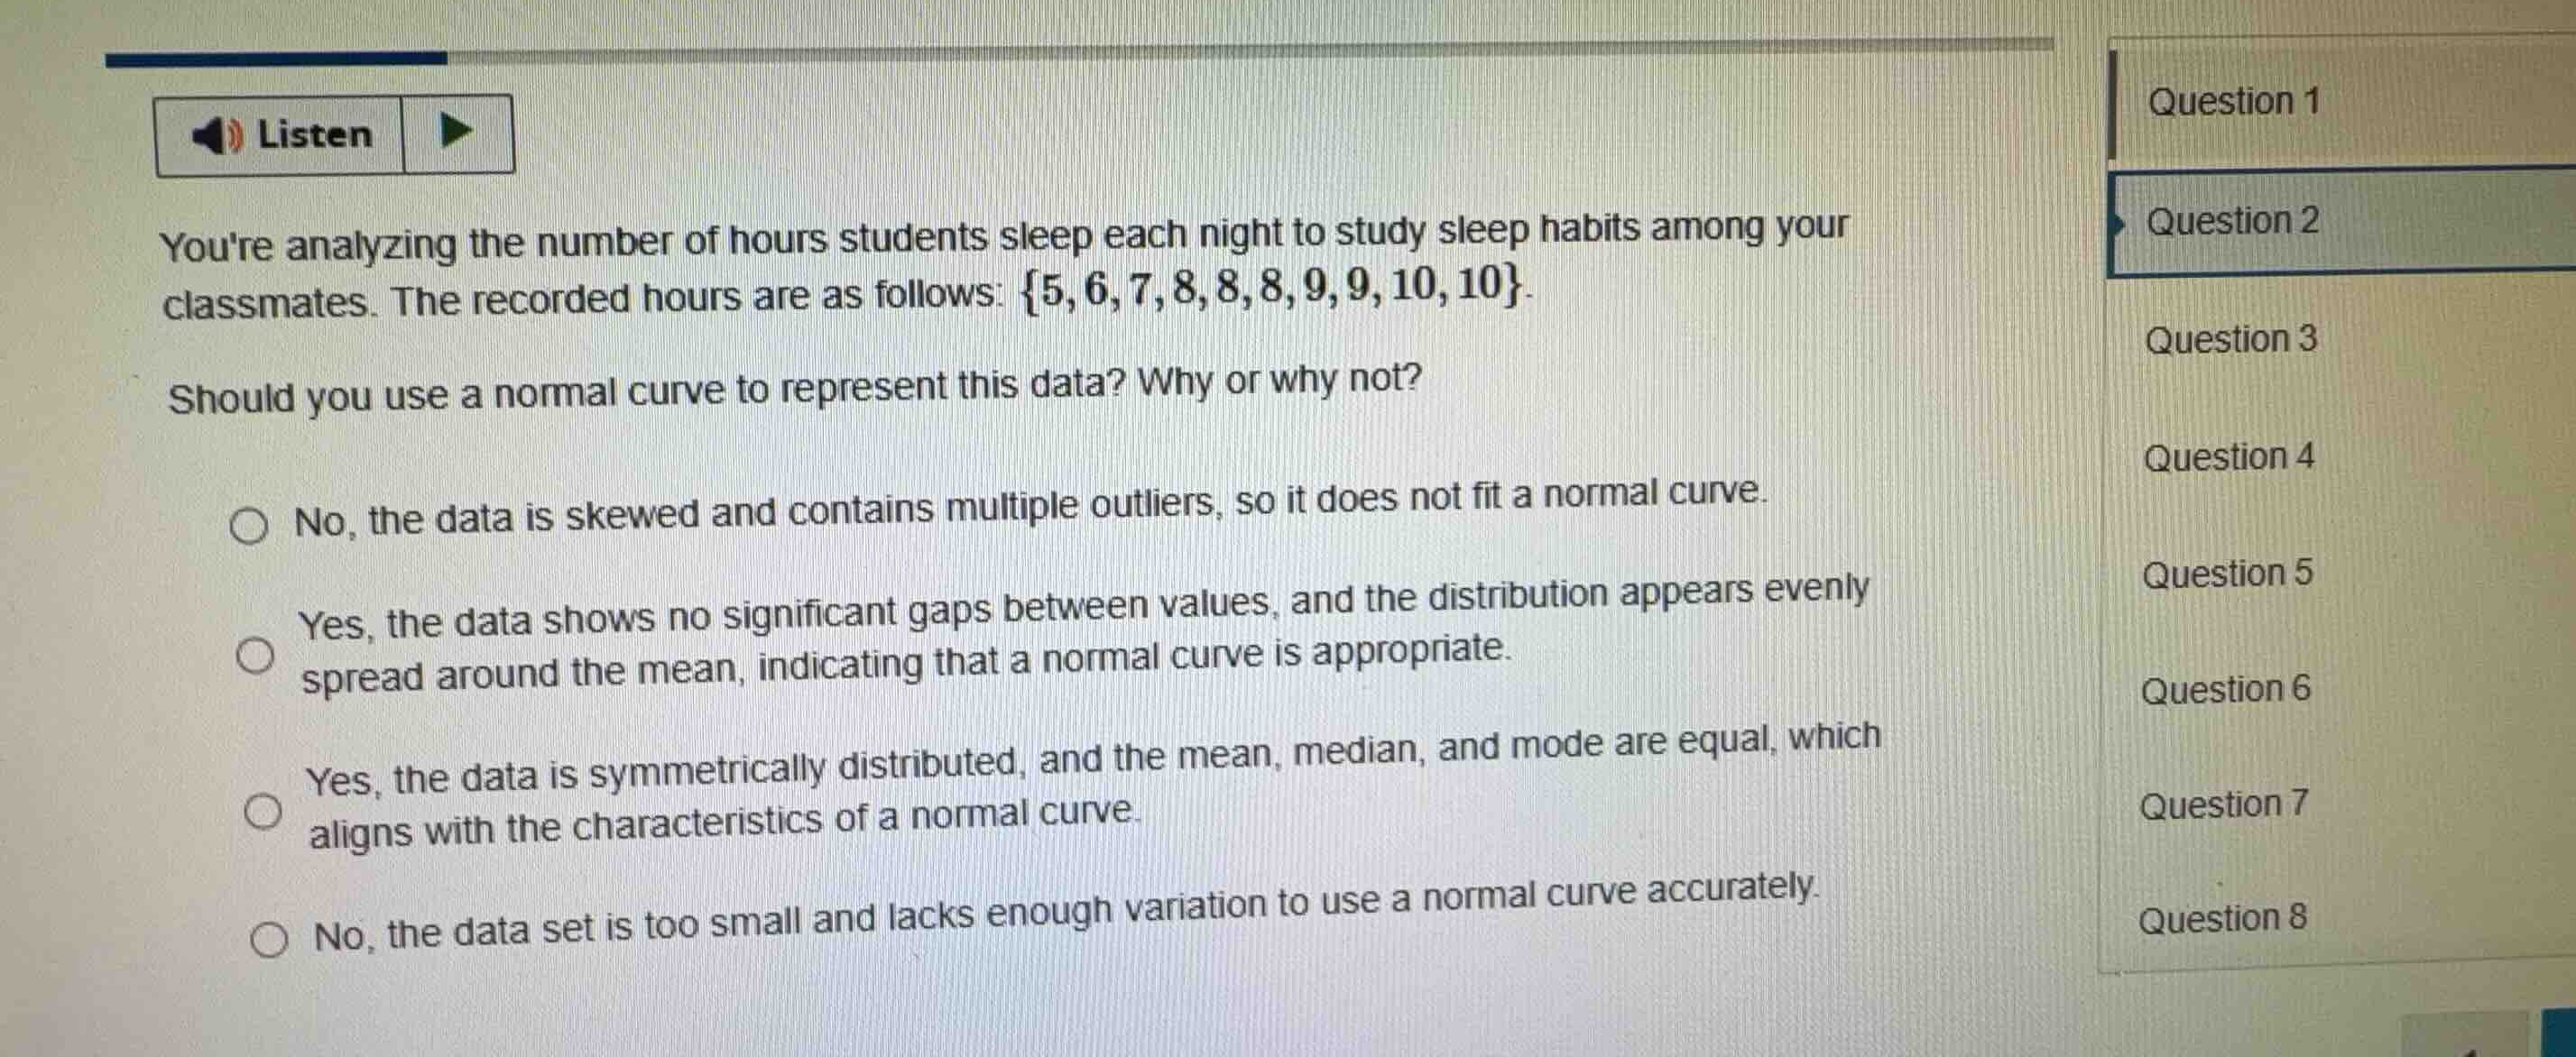
youre analyzing the number of hours students sleep each night to study sleep habits among your classmates. the recorded hours are as follows: \\(\\{5, 6, 7, 8, 8, 8, 9, 9, 10, 10\\}\\).
should you use a normal curve to represent this data? why or why not?
no, the data is skewed and contains multiple outliers, so it does not fit a normal curve.
yes, the data shows no significant gaps between values, and the distribution appears evenly spread around the mean, indicating that a normal curve is appropriate.
yes, the data is symmetrically distributed, and the mean, median, and mode are equal, which aligns with the characteristics of a normal curve.
no, the data set is too small and lacks enough variation to use a normal curve accurately.
Analyze the given dataset
Calculate central tendency measures
Evaluate distribution symmetry
The data is symmetrically distributed around the center value of 8, which aligns with the characteristics of a normal curve.

Snap & solve any problem in the app
Get step-by-step solutions on Sovi AI
Photo-based solutions with guided steps
Explore more problems and detailed explanations
- (A) No, the data is skewed and contains multiple outliers, so it does not fit a normal curve.
- (B) Yes, the data shows no significant gaps between values, and the distribution appears evenly spread around the mean, indicating that a normal curve is appropriate.
- (C) Yes, the data is symmetrically distributed, and the mean, median, and mode are equal, which aligns with the characteristics of a normal curve. (Correct answer)
- (D) No, the data set is too small and lacks enough variation to use a normal curve accurately.