QUESTION IMAGE
Question
writing equations to model data
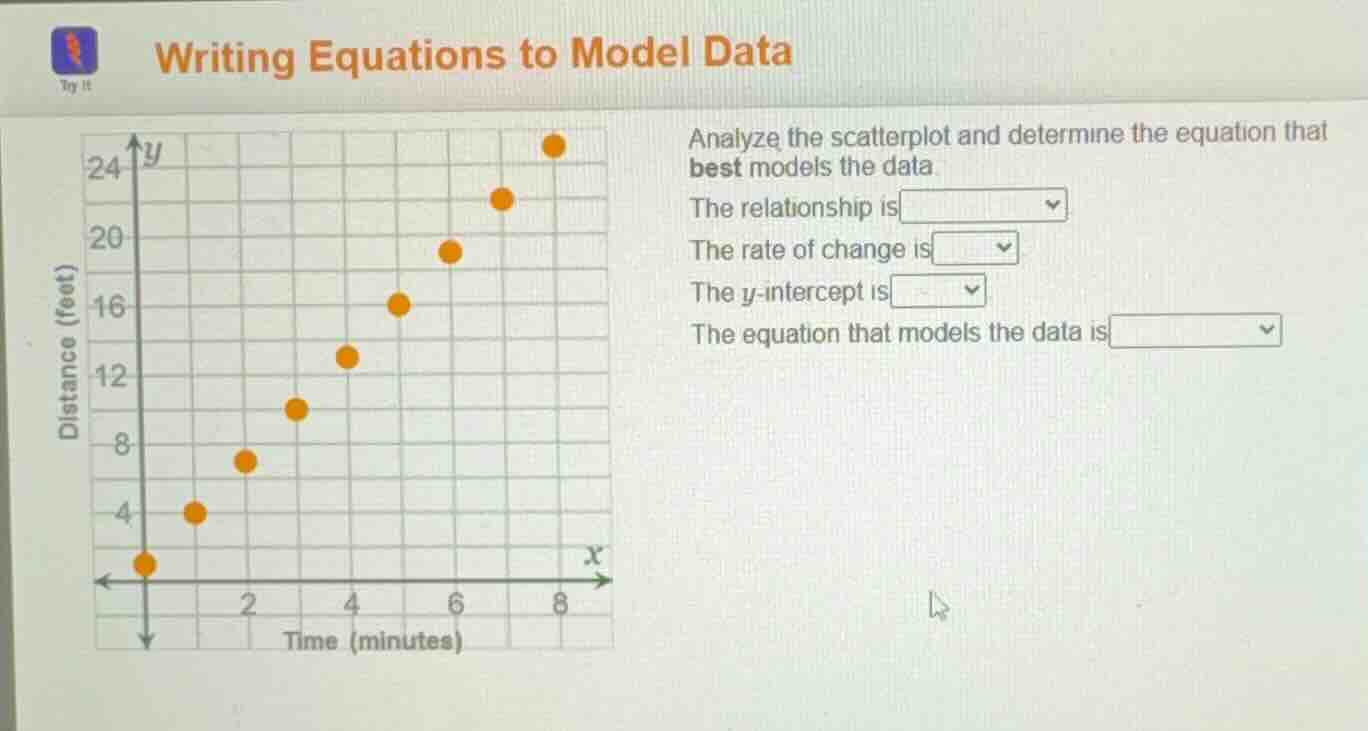
analyze the scatterplot and determine the equation that best models the data.
the relationship is dropdown
the rate of change is dropdown
the \\(y\\)-intercept is dropdown
the equation that models the data is dropdown
Identify the relationship type
Using the Linear Modeling knowledge point
The data points plotted on the scatterplot are:
Since these points lie perfectly on a straight line, the relationship is linear.
Calculate the rate of change
Using the Slope Formula and Average Rate of Change knowledge points
The rate of change is 3.
Determine the y-intercept
Using the Linear Modeling knowledge point
The line crosses the vertical axis at \( (0, 1) \).
The y-intercept is 1 (or the point \( (0, 1) \)).
Formulate the linear equation
Using the Linear Modeling knowledge point
The equation that models the data is \(y = 3x + 1\).

Snap & solve any problem in the app
Get step-by-step solutions on Sovi AI
Photo-based solutions with guided steps
Explore more problems and detailed explanations
Analyze the scatterplot and determine the equation that best models the data.
The relationship is <blank>linear</blank>.
The rate of change is <blank>3</blank>.
The y-intercept is <blank>1</blank> (or <blank>\((0, 1)\)</blank>).
The equation that models the data is <blank>\(y = 3x + 1\)</blank>.