QUESTION IMAGE
Question
which graph represents the function \\(f(x) = \frac{1}{x} - 1\\)?
Identify asymptotes and key features
The given function is:
$$
f(x) = \frac{1}{x} - 1
$$
- Vertical asymptote: \(x = 0\) (the y-axis).
- Horizontal asymptote: \(y = -1\).
- \(x\)-intercept: Set \(f(x) = 0 \implies \frac{1}{x} - 1 = 0 \implies x = 1\).
- Key points:
- For \(x = 1\), \(y = 0\).
- For \(x = -1\), \(y = -2\).
Analyze the given graph
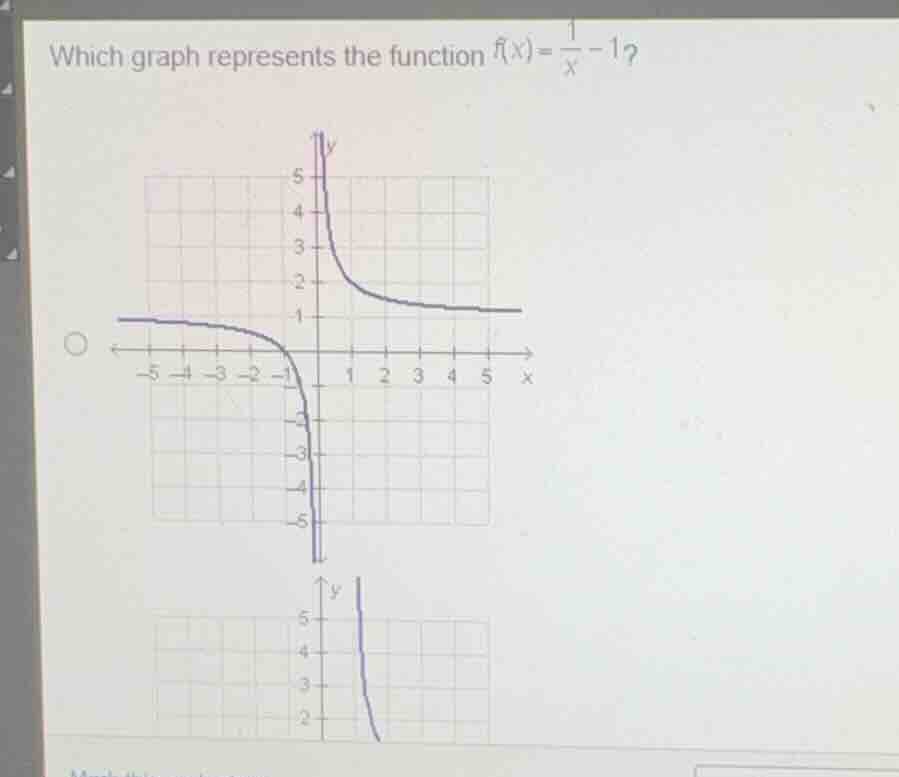
- The visible graph has a vertical asymptote at \(x = 0\).
- The horizontal asymptote is at \(y = 1\).
- The \(x\)-intercept is at \(x = -1\).
- This graph represents \(y = \frac{1}{x} + 1\), which does not match \(f(x) = \frac{1}{x} - 1\).
Determine the correct graph behavior
- The correct graph of \(f(x) = \frac{1}{x} - 1\) must be shifted down by 1 unit compared to the parent function \(y = \frac{1}{x}\).
- Its horizontal asymptote must be \(y = -1\).
- It must pass through \((1, 0)\) and \((-1, -2)\).

Snap & solve any problem in the app
Get step-by-step solutions on Sovi AI
Photo-based solutions with guided steps
Explore more problems and detailed explanations
The correct graph representing the function \(f(x) = \frac{1}{x} - 1\) is the one that has a vertical asymptote at \(x = 0\), a horizontal asymptote at \(y = -1\), and passes through the points \((1, 0)\) and \((-1, -2)\).
Since the displayed graph has a horizontal asymptote at \(y = 1\) and passes through \((-1, 0)\), it represents \(y = \frac{1}{x} + 1\) and is incorrect. The correct option is the other graph choice (partially cut off at the bottom of the image) which is shifted downwards.
- (A) The displayed graph with horizontal asymptote at \(y = 1\)
- (B) The correct graph with horizontal asymptote at \(y = -1\) (Correct answer)