QUESTION IMAGE
Question
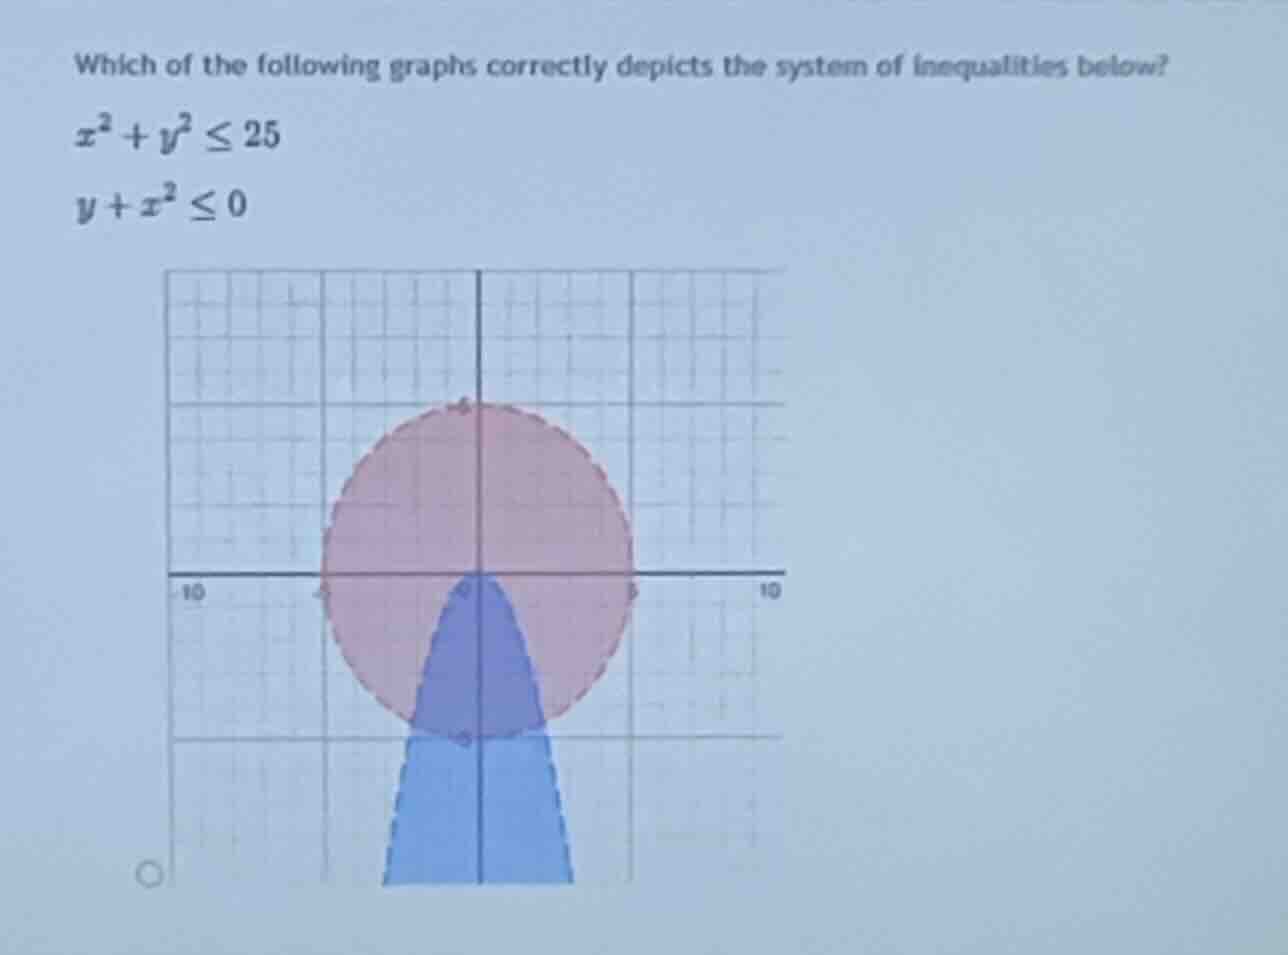
which of the following graphs correctly depicts the system of inequalities below?
\\x^2 + y^2 \le 25\\
\\y + x^2 \le 0\\
Step1: Analyze the first inequality
This represents the region inside and on a circle centered at \((0,0)\) with radius \(5\), drawn with a solid boundary.
Step2: Analyze the second inequality
This represents the region on and below the parabola \(y = -x^2\), opening downwards with vertex at \((0,0)\), drawn with a solid boundary.
Step3: Identify the intersection region
The solution is the overlapping region inside the circle and below the parabola, which is correctly depicted by the darker shaded region in the provided graph.

Snap & solve any problem in the app
Get step-by-step solutions on Sovi AI
Photo-based solutions with guided steps
Explore more problems and detailed explanations
The correct graph is the one shown in the image, which features a solid boundary for the circle \(x^2 + y^2 = 25\) shaded inside, and a solid boundary for the parabola \(y = -x^2\) shaded below, with their intersection shaded in a darker overlapping region.