QUESTION IMAGE
Question
which of the following is the graph of this rational function?
\\y = \frac{1}{x} - 3\\
Identify asymptotes of the function
We analyze the rational function:
$$y = \frac{1}{x} - 3$$
The vertical asymptote occurs where the denominator is zero:
$$x = 0$$
The horizontal asymptote is determined by the vertical shift:
$$y = -3$$
Analyze key points on the graph
We evaluate the function at simple test points to find coordinates:
For \(x = 1\):
$$y = \frac{1}{1} - 3 = -2 \implies (1, -2)$$
For \(x = -1\):
$$y = \frac{1}{-1} - 3 = -4 \implies (-1, -4)$$
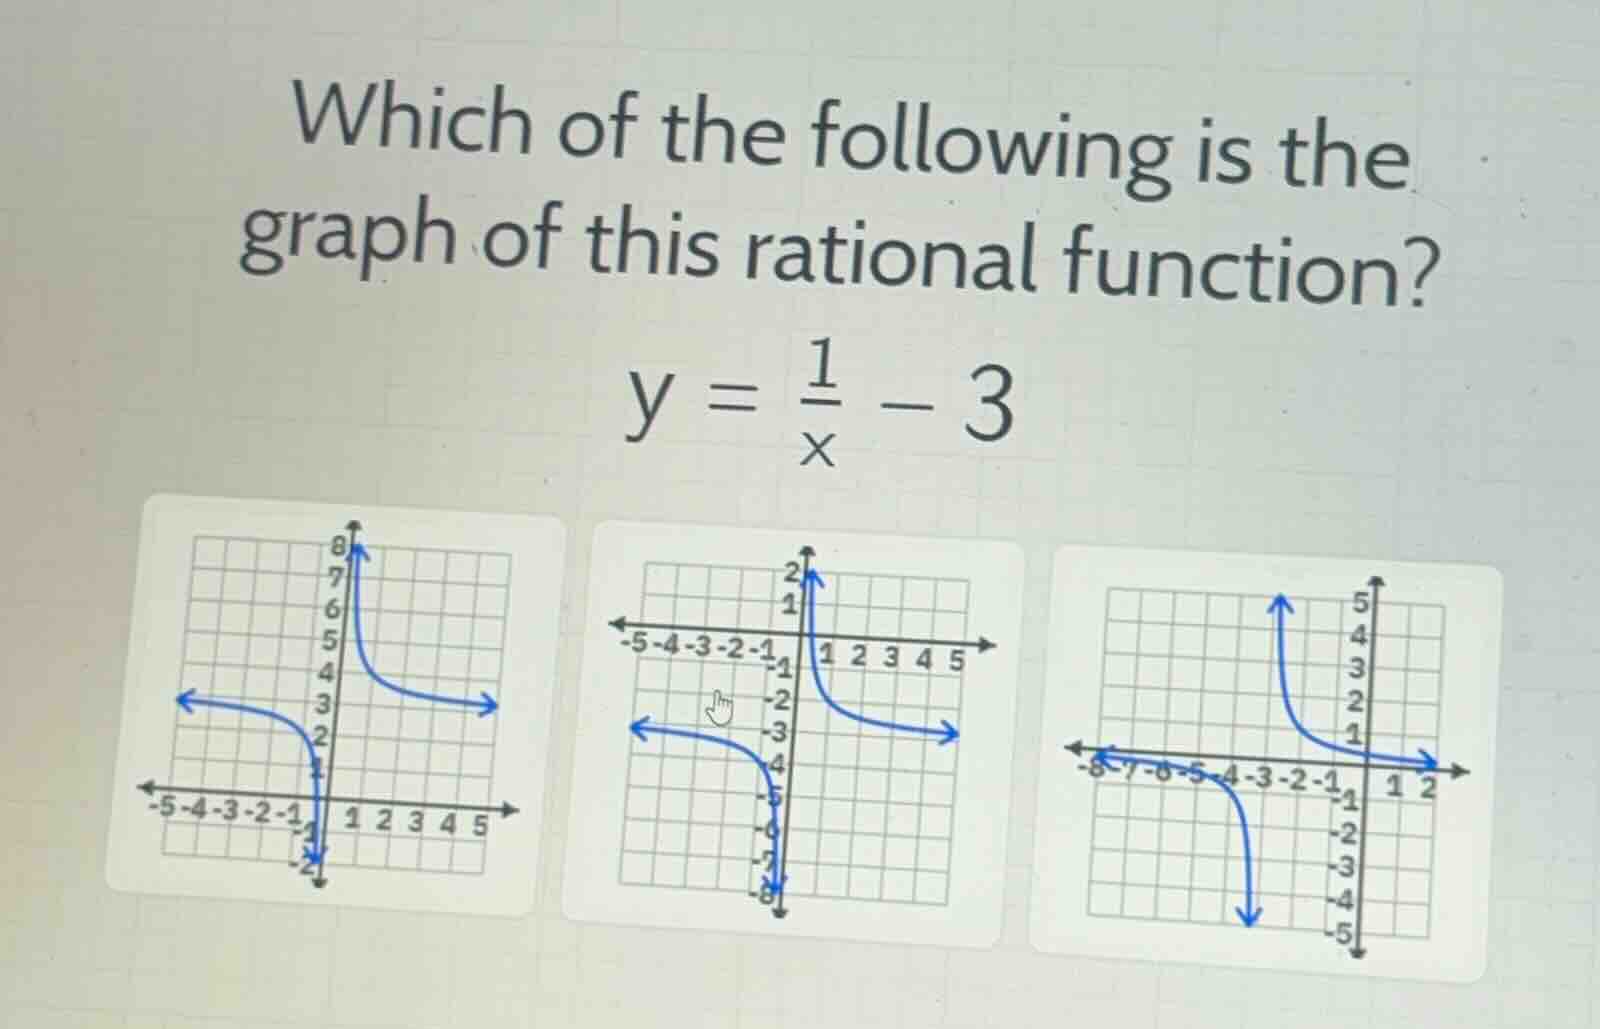
Match with the given options
We compare our findings with the three graphs:
- First graph: The horizontal asymptote is at \(y = 3\). This is incorrect.
- Second graph: The horizontal asymptote is at \(y = -3\). The vertical asymptote is at \(x = 0\) (the y-axis). It passes through \((1, -2)\) and \((-1, -4)\). This matches our function.
- Third graph: The vertical asymptote is at \(x = -3\). This is incorrect.

Snap & solve any problem in the app
Get step-by-step solutions on Sovi AI
Photo-based solutions with guided steps
Explore more problems and detailed explanations
- (A) Graph with horizontal asymptote at \(y = 3\)
- (B) Graph with horizontal asymptote at \(y = -3\) (Correct answer)
- (C) Graph with vertical asymptote at \(x = -3\)