QUESTION IMAGE
Question
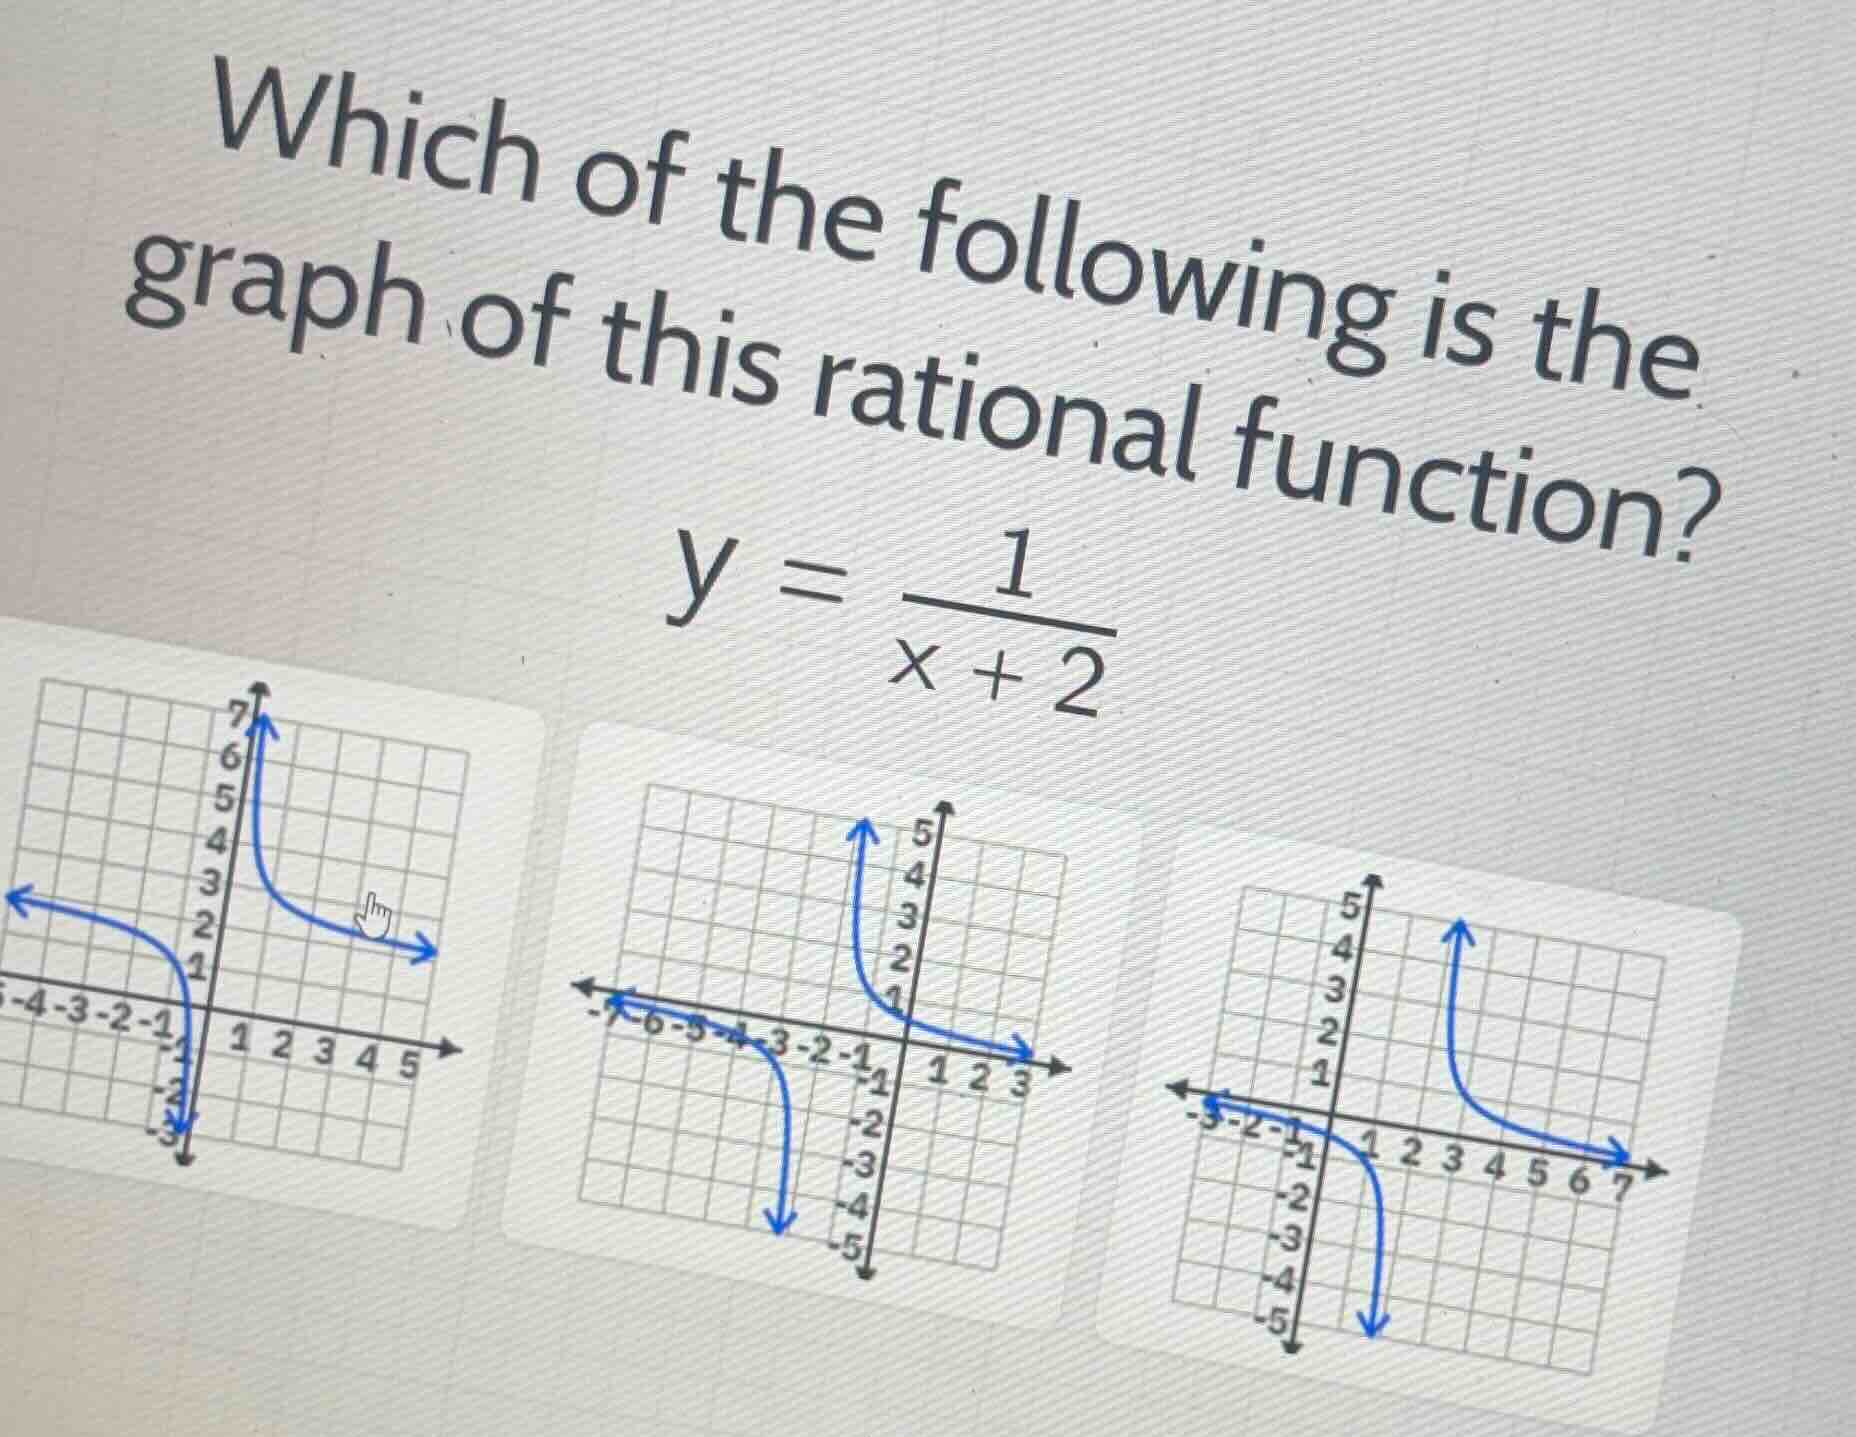
which of the following is the graph of this rational function?
\\y = \frac{1}{x + 2}\\
Identify the asymptotes of the function
Using the Asymptotes of Rational Functions knowledge point
$$
LATEXBLOCK0
$$
Analyze the behavior and key points
Using the Graphing Rational Functions knowledge point
$$
LATEXBLOCK1
$$
Match with the given options
We examine the three graphs from left to right:
- First graph (left): Has a vertical asymptote at \(x = 0\) and a horizontal asymptote at \(y = 1\). This does not match.
- Second graph (middle): Has a vertical asymptote at \(x = -2\) and a horizontal asymptote at \(y = 0\). For \(x > -2\), the curve is in the upper half-plane (\(y > 0\)), and for \(x < -2\), it is in the lower half-plane (\(y < 0\)). This matches our function perfectly.
- Third graph (right): Has a vertical asymptote at \(x = 3\) and a horizontal asymptote at \(y = 0\). This does not match.

Snap & solve any problem in the app
Get step-by-step solutions on Sovi AI
Photo-based solutions with guided steps
Explore more problems and detailed explanations
- (A) Left graph: vertical asymptote at \(x = 0\), horizontal asymptote at \(y = 1\)
- (B) Middle graph: vertical asymptote at \(x = -2\), horizontal asymptote at \(y = 0\) (Correct answer)
- (C) Right graph: vertical asymptote at \(x = 3\), horizontal asymptote at \(y = 0\)