QUESTION IMAGE
Question
which describe the points on the scatterplot?
check all that apply.
there is a relationship between the time walked and the distance walked.
as the number of minutes walked increases, the number of feet walked increases.
the data points are tightly grouped.
distance walked is the dependent variable because it is influenced by the amount of time walked.
the scatterplot compares bivariate data.
Analyze the scatterplot trend and variables
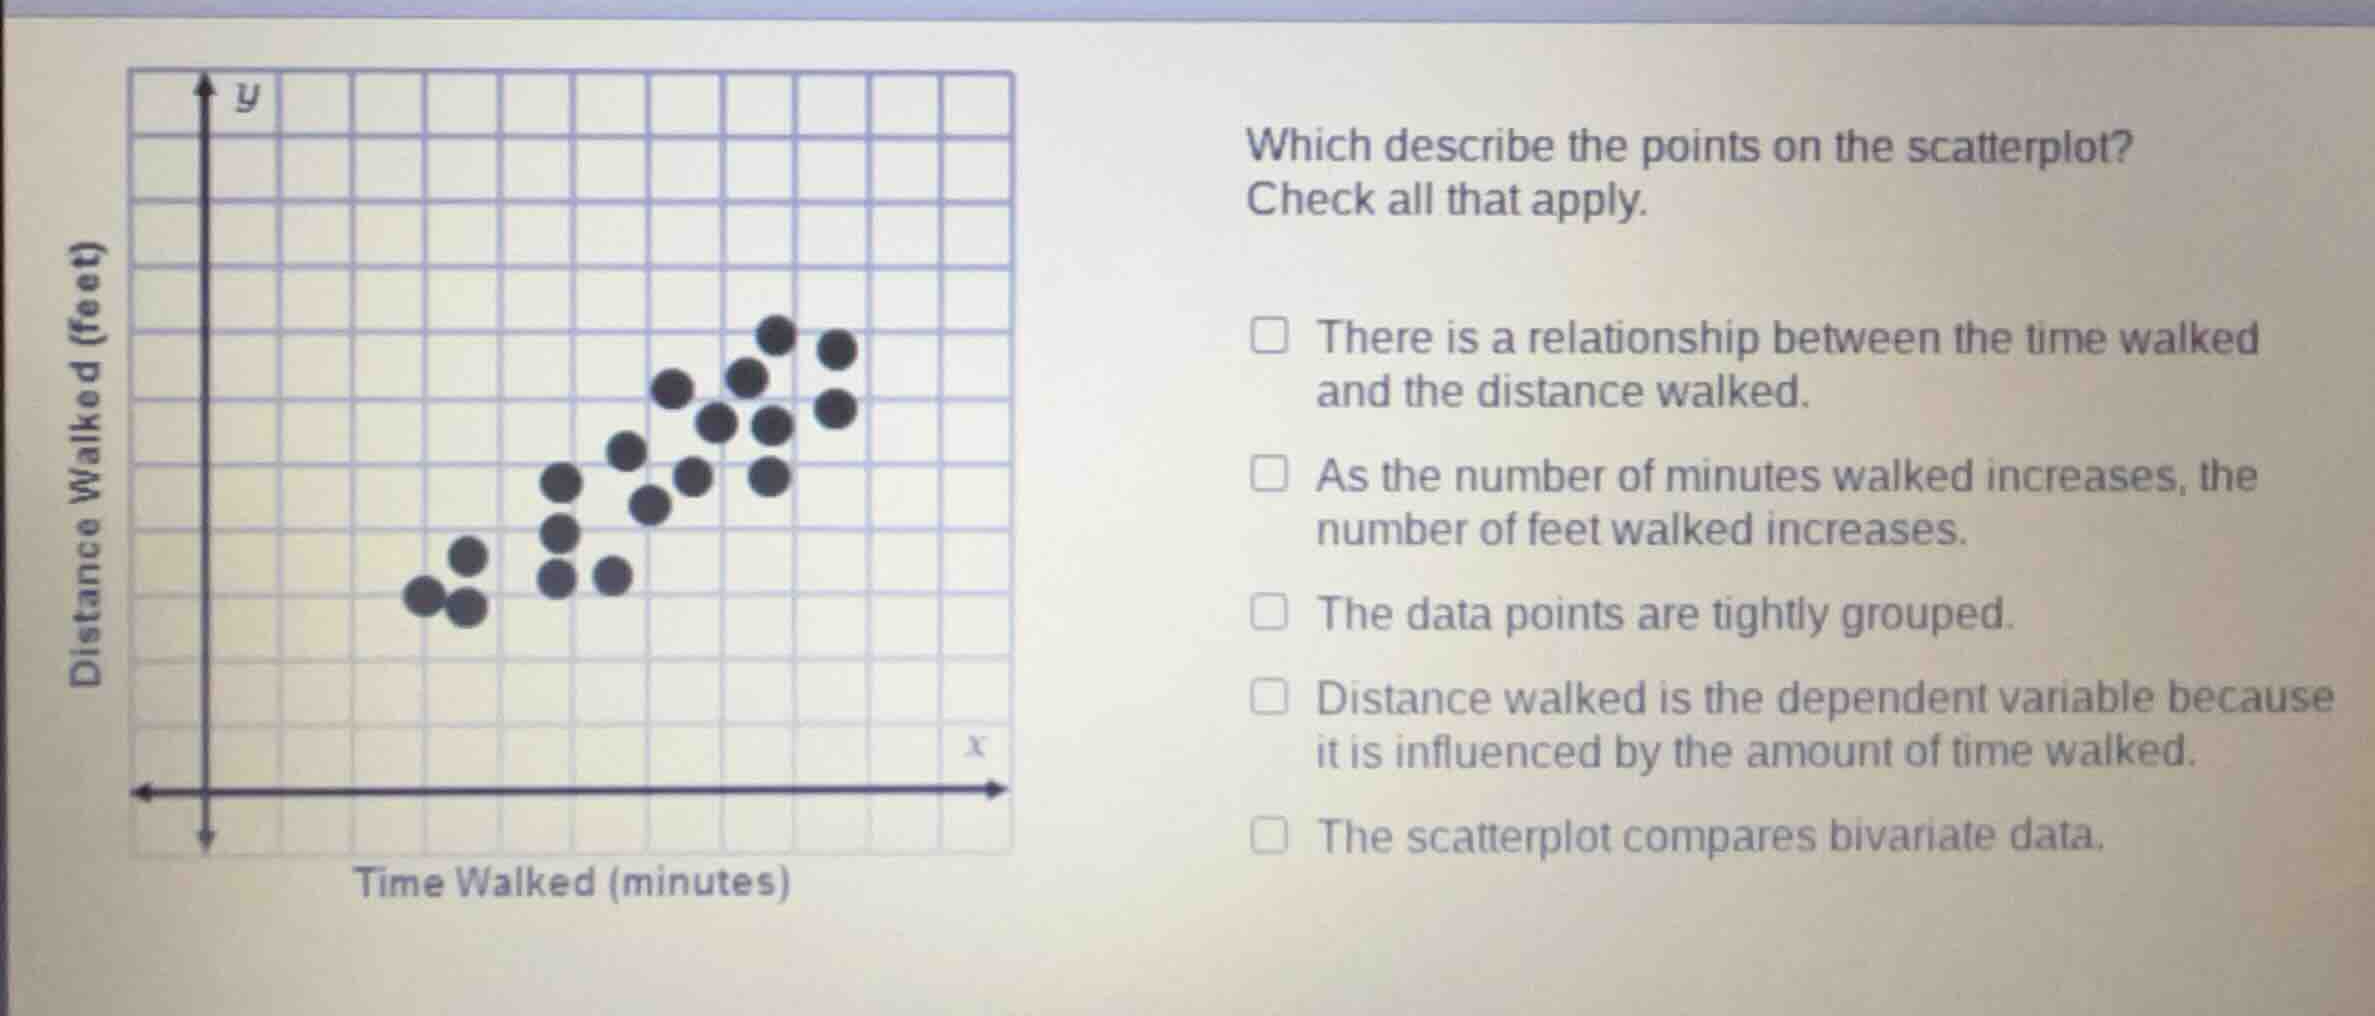
The horizontal axis represents "Time Walked (minutes)" (independent variable) and the vertical axis represents "Distance Walked (feet)" (dependent variable). Since distance depends on time, distance is the dependent variable. The plot shows two variables, which means it compares bivariate data.
Evaluate the relationship and data distribution
As the x-value (time) increases, the y-value (distance) generally increases, showing a positive relationship. The points are not tightly grouped; they are moderately scattered, indicating a moderate positive correlation rather than a tight grouping.
Determine the correct statements
- "There is a relationship between the time walked and the distance walked" is correct (positive correlation).
- "As the number of minutes walked increases, the number of feet walked increases" is correct (positive trend).
- "The data points are tightly grouped" is incorrect (they show moderate scatter).
- "Distance walked is the dependent variable because it is influenced by the amount of time walked" is correct.
- "The scatterplot compares bivariate data" is correct (it plots two variables).

Snap & solve any problem in the app
Get step-by-step solutions on Sovi AI
Photo-based solutions with guided steps
Explore more problems and detailed explanations
- There is a relationship between the time walked and the distance walked. (Correct answer)
- As the number of minutes walked increases, the number of feet walked increases. (Correct answer)
- The data points are tightly grouped.
- Distance walked is the dependent variable because it is influenced by the amount of time walked. (Correct answer)
- The scatterplot compares bivariate data. (Correct answer)