QUESTION IMAGE
Question
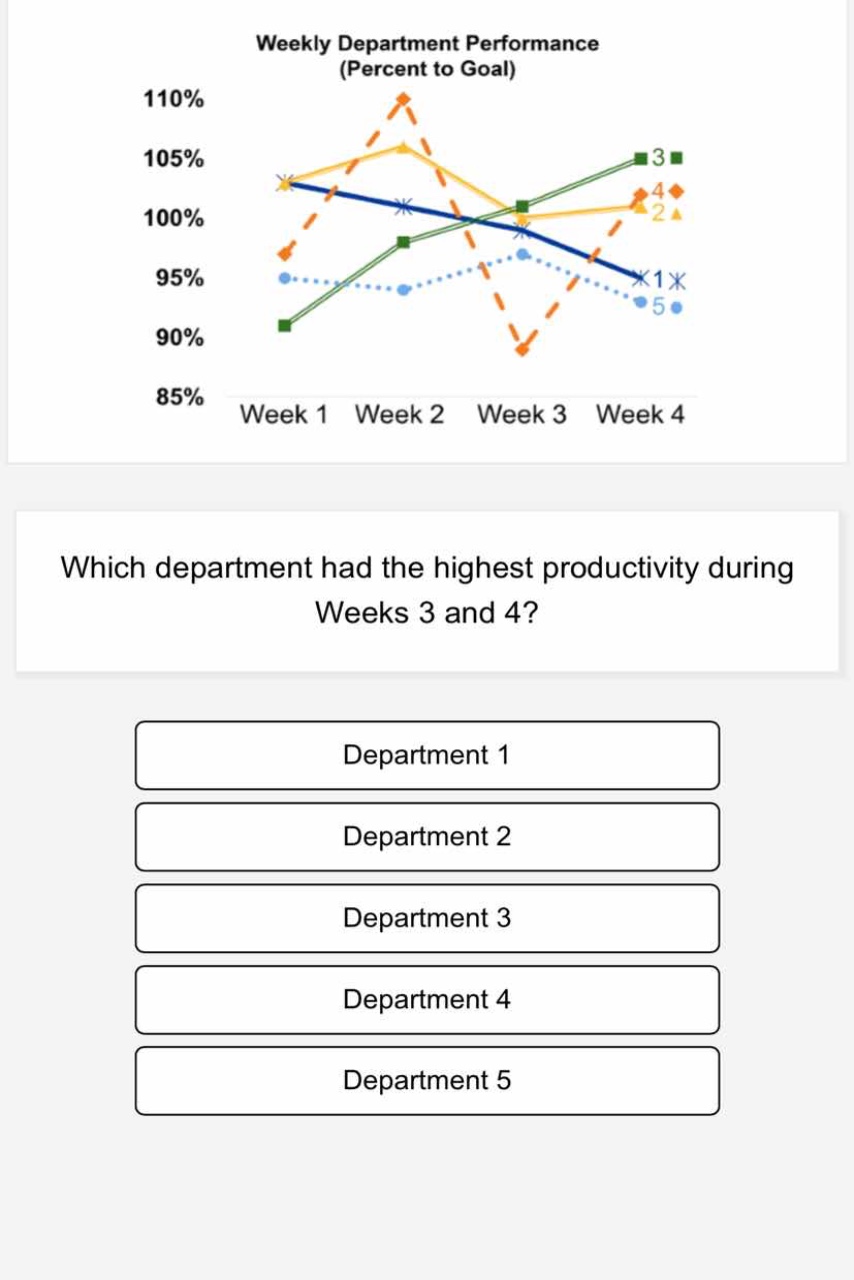
which department had the highest productivity during weeks 3 and 4?
department 1
department 2
department 3
department 4
department 5
Identify the target departments and weeks
Using the Data Interpretation knowledge point
- Target period: Week 3 and Week 4.
- We need to evaluate the performance (percent to goal) for each of the five departments during these two weeks to find the highest overall productivity.
Extract data points for Week 3 and Week 4
Using the Data Interpretation knowledge point
- Department 1 (dark blue line with asterisks):
- Week 3: \(99\%\)
- Week 4: \(95\%\)
- Department 2 (yellow line with triangles):
- Week 3: \(100\%\)
- Week 4: \(101\%\)
- Department 3 (green line with squares):
- Week 3: \(101\%\)
- Week 4: \(105\%\)
- Department 4 (orange dashed line with diamonds):
- Week 3: \(89\%\)
- Week 4: \(102\%\)
- Department 5 (light blue dotted line with circles):
- Week 3: \(97\%\)
- Week 4: \(93\%\)
Calculate average productivity for the period
Using the Average Productivity Analysis knowledge point
- Department 1: \(\frac{99\% + 95\%}{2} = 97\%\)
- Department 2: \(\frac{100\% + 101\%}{2} = 100.5\%\)
- Department 3: \(\frac{101\% + 105\%}{2} = 103\%\)
- Department 4: \(\frac{89\% + 102\%}{2} = 95.5\%\)
- Department 5: \(\frac{97\% + 93\%}{2} = 95\%\)
Compare results to find the maximum
Using the Average Productivity Analysis knowledge point
- Comparing the averages: \(103\% > 100.5\% > 97\% > 95.5\% > 95\%\).
- Department 3 has the highest productivity during Weeks 3 and 4.

Snap & solve any problem in the app
Get step-by-step solutions on Sovi AI
Photo-based solutions with guided steps
Explore more problems and detailed explanations
- Department 1
- Department 2
- Department 3 (Correct answer)
- Department 4
- Department 5