QUESTION IMAGE
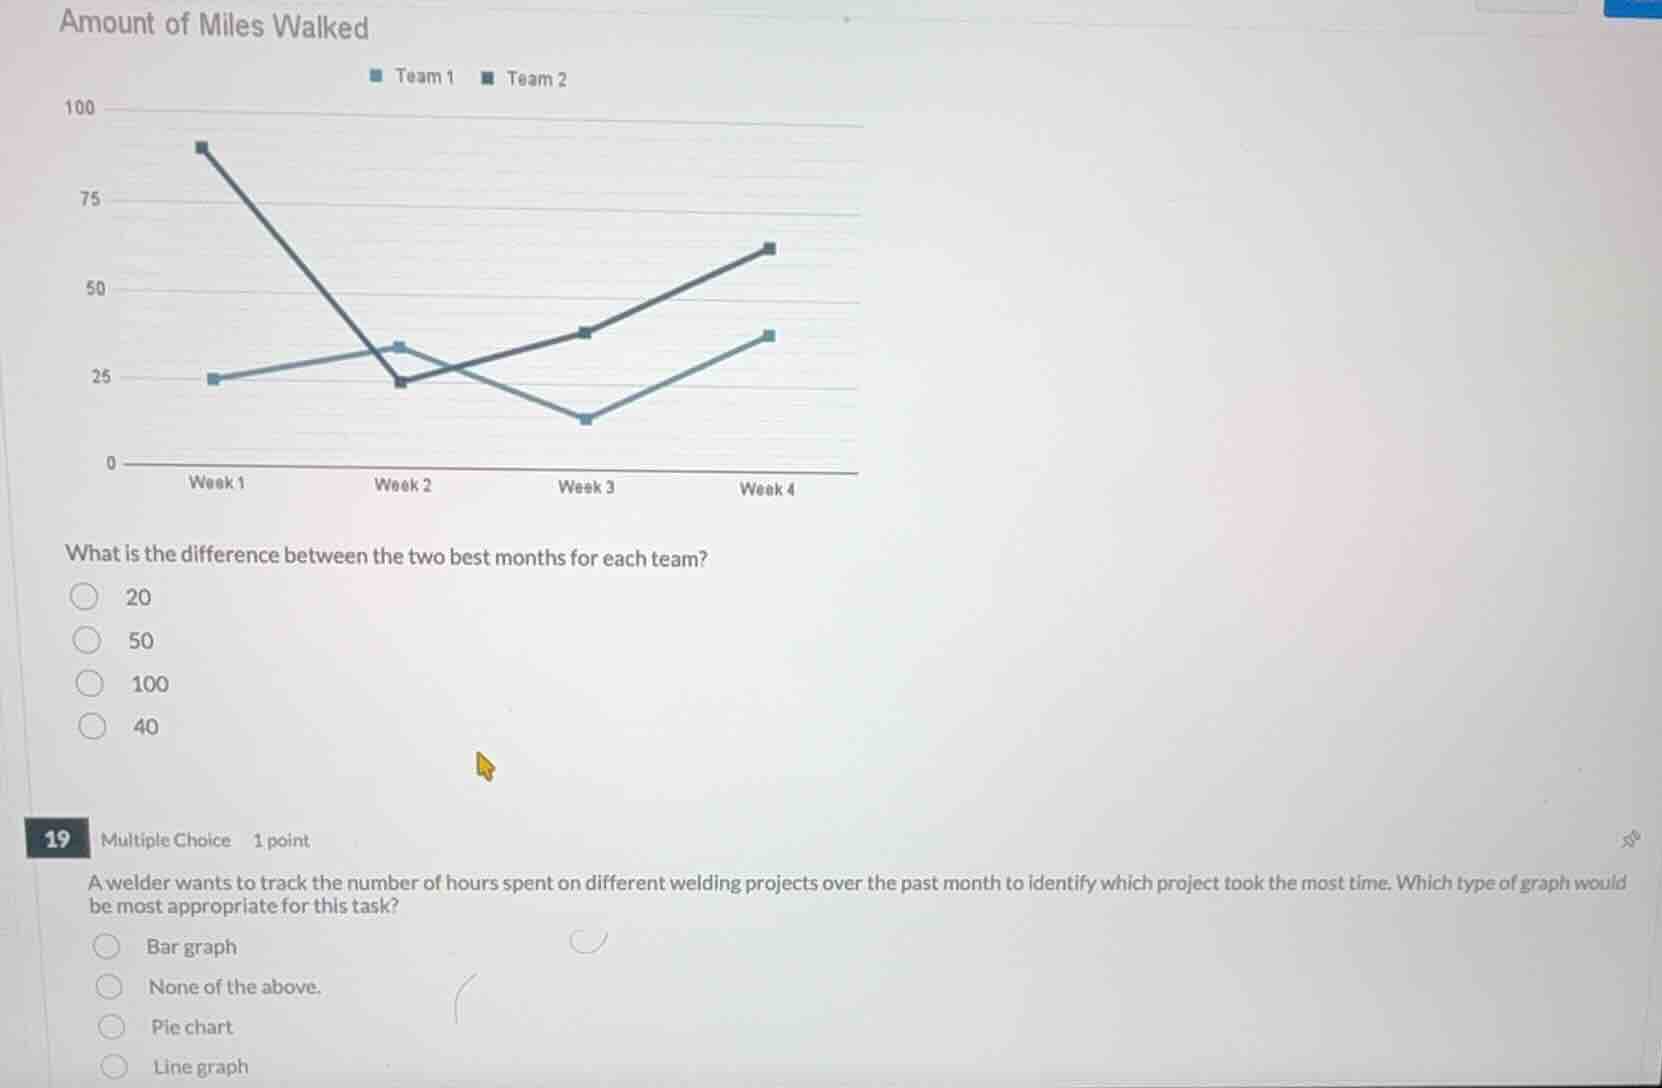
Question
what is the difference between the two best months for each team?
20
50
100
40
19 multiple choice 1 point
a welder wants to track the number of hours spent on different welding projects over the past month to identify which project took the most time. which type of graph would be most appropriate for this task?
bar graph
none of the above.
pie chart
line graph
Question 1: Find the best week for each team and calculate the difference
$$
LATEXBLOCK0
$$
Question 2: Determine the most appropriate graph type
$$
LATEXBLOCK1
$$

Snap & solve any problem in the app
Get step-by-step solutions on Sovi AI
Photo-based solutions with guided steps
Explore more problems and detailed explanations
Question 1
- (A) 20
- (B) 50 (Correct answer)
- (C) 100
- (D) 40
Question 2
- (A) Bar graph (Correct answer)
- (B) None of the above.
- (C) Pie chart
- (D) Line graph