QUESTION IMAGE
Question
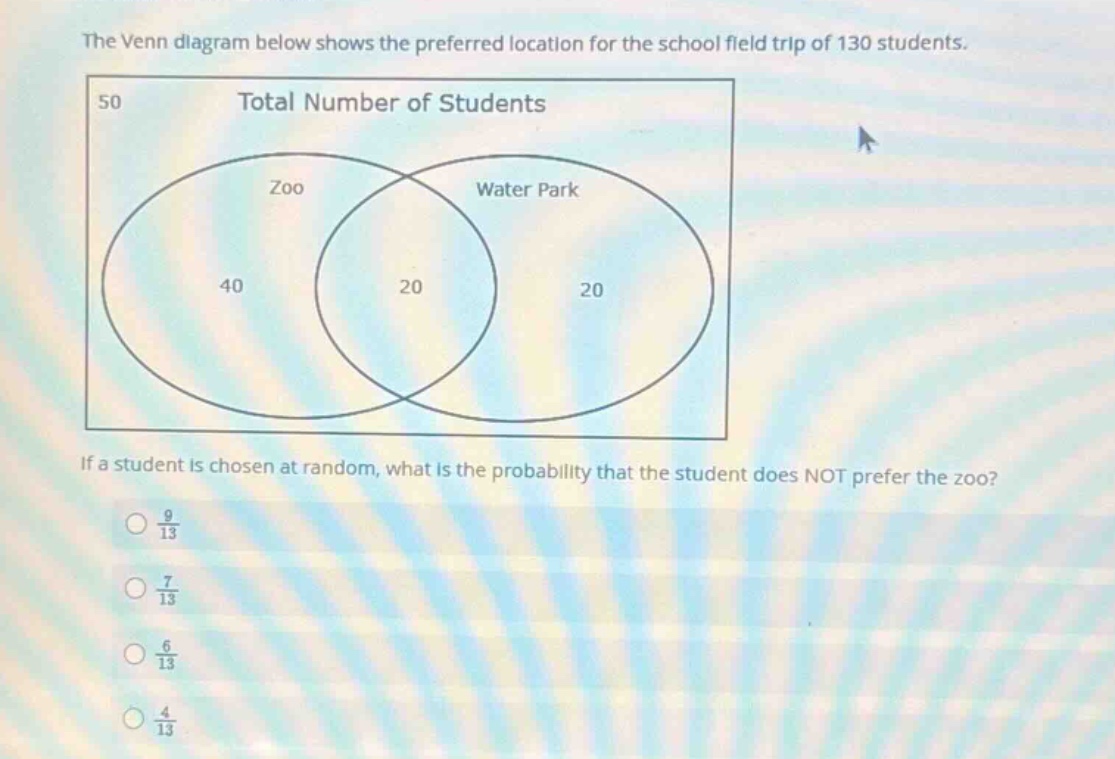
the venn diagram below shows the preferred location for the school field trip of 130 students.
if a student is chosen at random, what is the probability that the student does not prefer the zoo?
\\(\frac{9}{13}\\)
\\(\frac{7}{13}\\)
\\(\frac{6}{13}\\)
\\(\frac{4}{13}\\)
⚡ Using what you learned: Venn Diagrams in Probability
Step 1: Identify the total number of students
The total number of students is given as:
We can also verify this by adding all the regions in the Venn diagram:
Step 2: Identify students who do NOT prefer the zoo
The students who prefer the zoo are represented by the entire "Zoo" circle, which includes:
The students who do NOT prefer the zoo are those outside the "Zoo" circle:
Alternatively, using the complement:
Step 3: Calculate the probability
The probability that a randomly chosen student does not prefer the zoo is the number of students who do not prefer the zoo divided by the total number of students:

Snap & solve any problem in the app
Get step-by-step solutions on Sovi AI
Photo-based solutions with guided steps
Explore more problems and detailed explanations