QUESTION IMAGE
Question
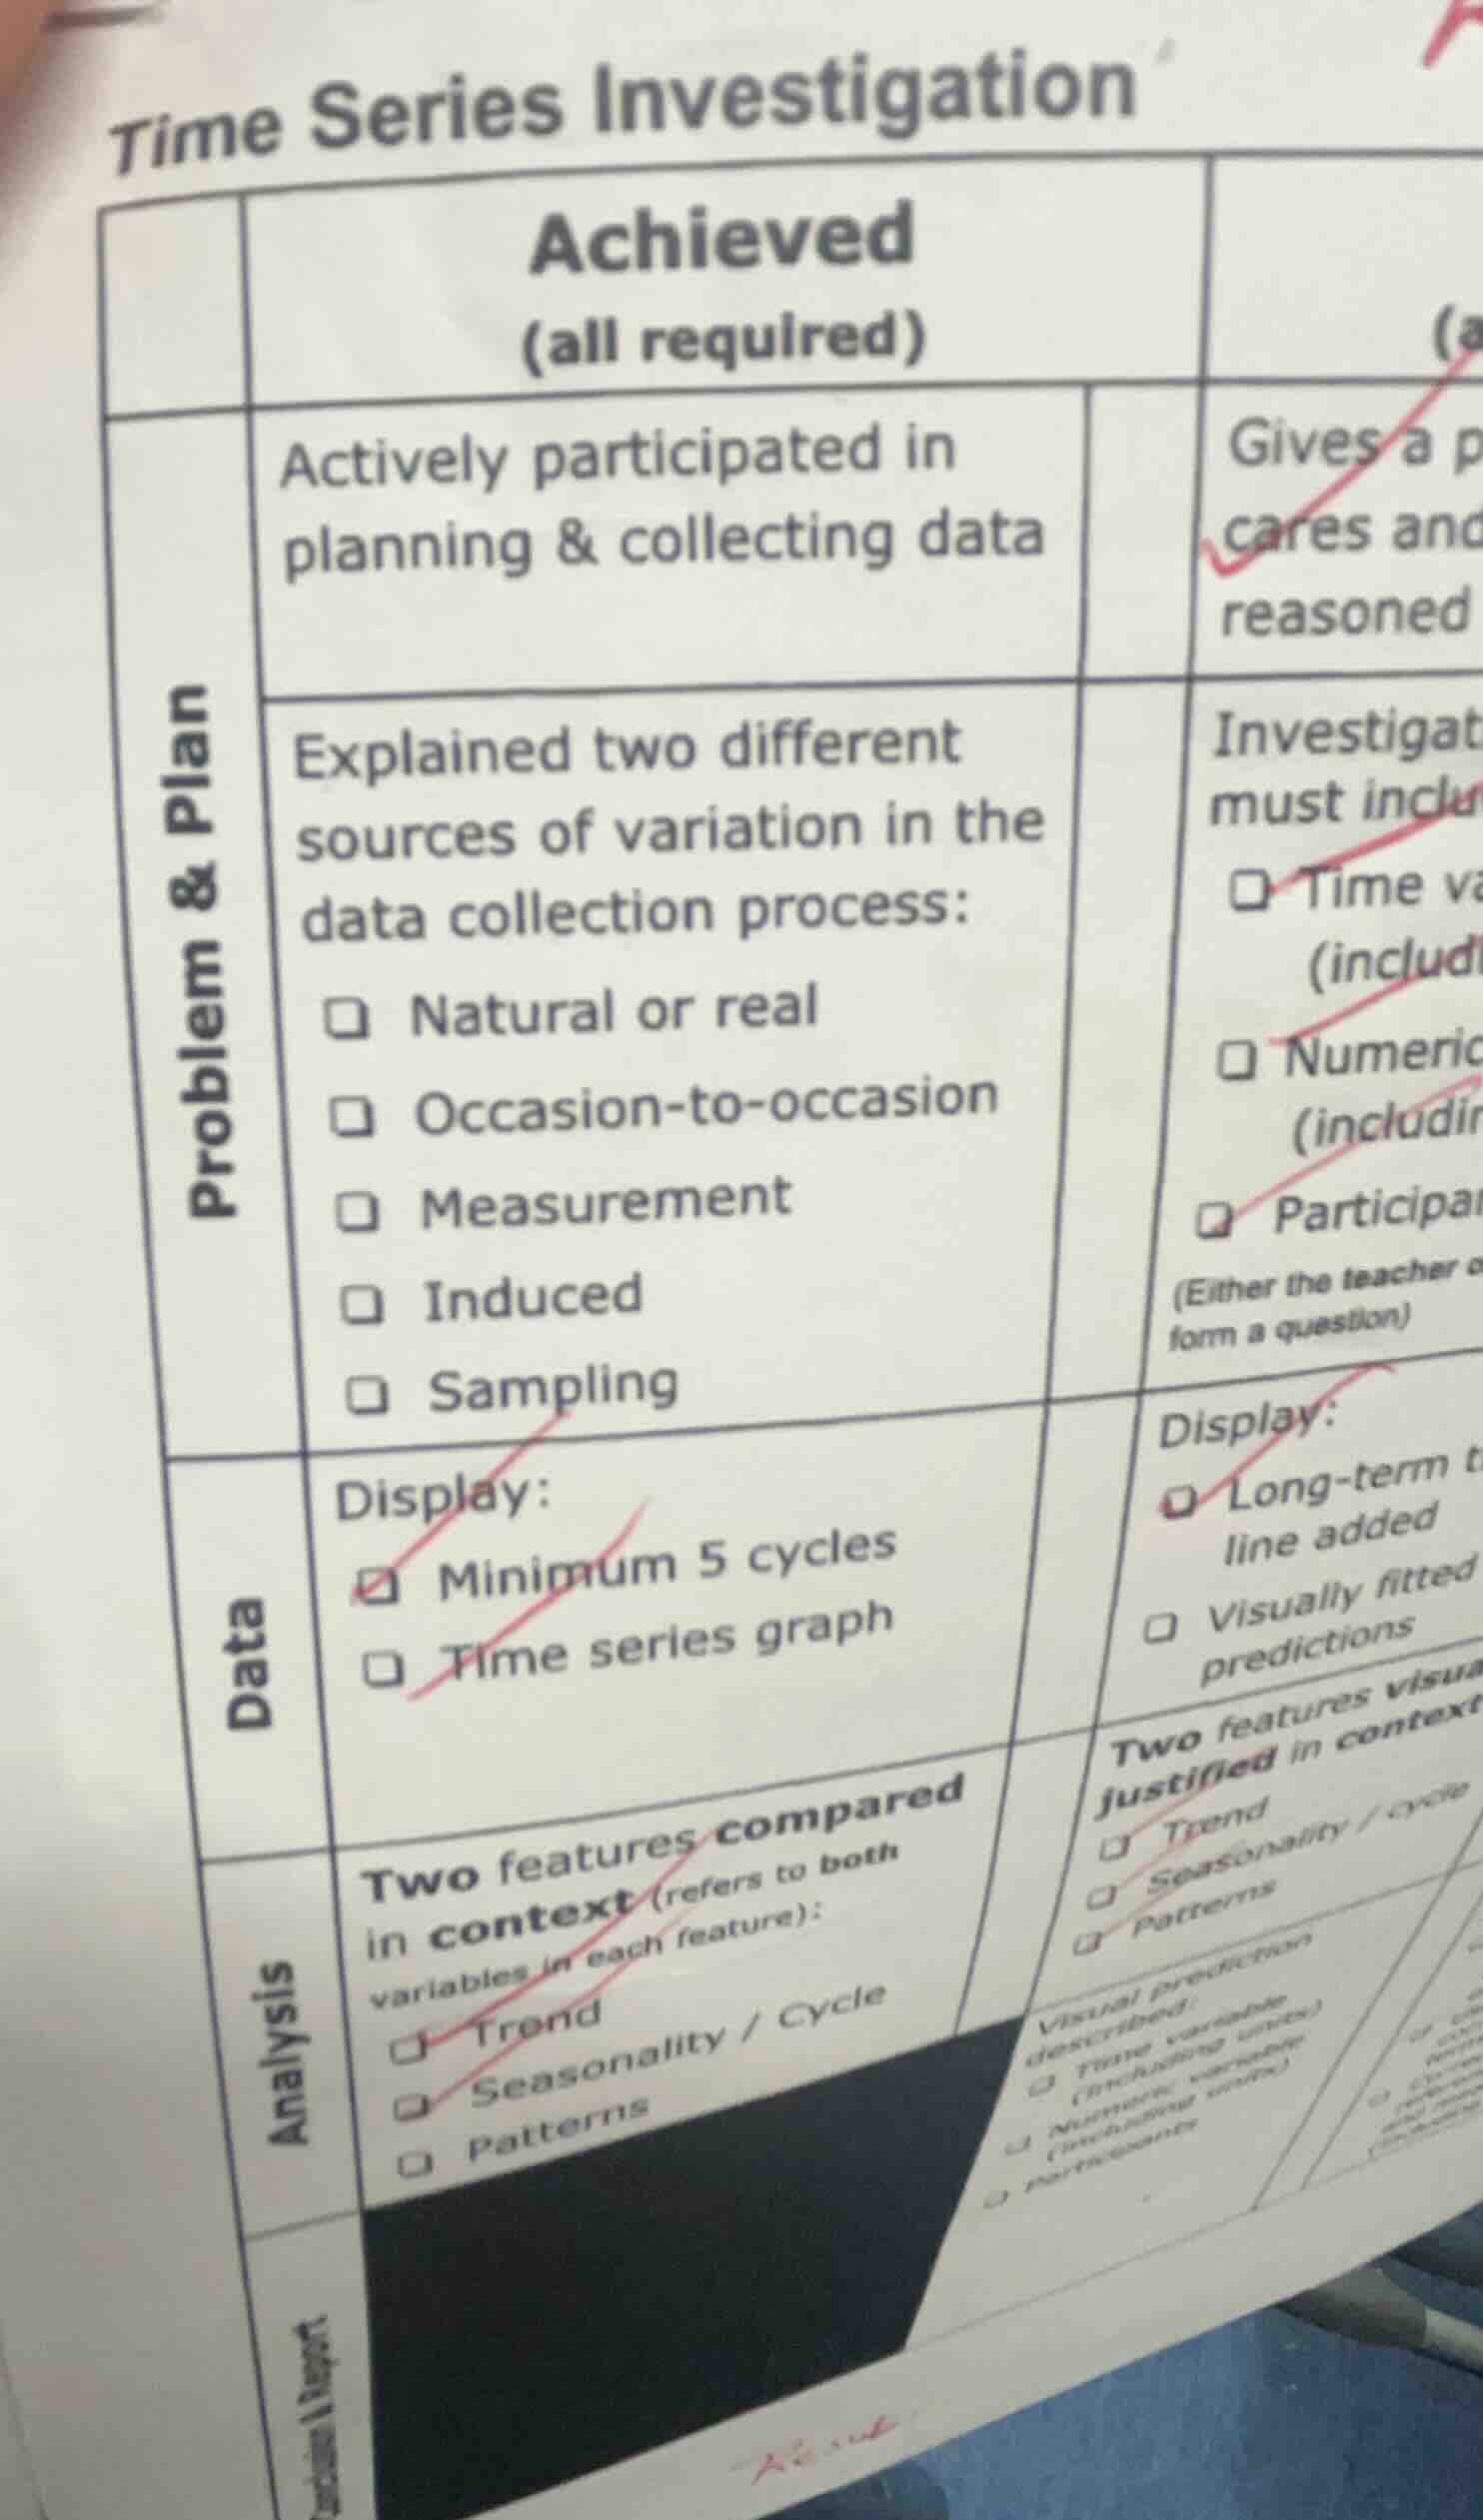
time series investigation
achieved (all required)
problem & plan
actively participated in planning & collecting data
explained two different sources of variation in the data collection process:
- natural or real
- occasion-to-occasion
- measurement
- induced
- sampling
data
display:
- minimum 5 cycles
- time series graph
analysis
two features compared in context (refers to both variables in each feature):
- trend
- seasonality / cycle
- patterns
Contextualize the EV dataset
To achieve excellence in a Statistical Investigation, we must analyze the five sources of variation specifically within the context of Electric Vehicle (EV) data collection (e.g., tracking monthly EV registrations, battery range performance, or charging station usage over time).
Natural or real variation
This represents the inherent differences between individual subjects in a population.
- EV Context: Different EV models naturally have different battery capacities, weights, and aerodynamic efficiencies, leading to varying energy consumption rates under identical driving conditions.
Occasion-to-occasion variation
This occurs when measurements on the same subject change over time or under different environmental conditions.
- EV Context: A single EV's driving range varies from day to day due to external temperature changes (affecting battery chemistry), cabin heating/cooling usage, or driving on hilly versus flat terrain.
Measurement variation
This stems from the limitations, precision, or errors of the recording instruments and methods.
- EV Context: Differences in how onboard computers estimate State of Charge (SoC) or remaining range (using algorithms that estimate battery health) versus the actual physical energy remaining in the lithium-ion cells.
Induced variation
This is variation deliberately introduced by the researcher or external factors to observe its effect on the response variable.
- EV Context: Testing the same fleet of EVs under controlled speeds (e.g., constant 50 km/h vs. 100 km/h) or comparing range outcomes when using Eco Mode versus Sport Mode.
Sampling variation
This arises because we collect data from a sample rather than the entire population, meaning different samples will yield different statistics.
- EV Context: If we select a random sample of 100 EV owners in a cold region, their average winter range will differ from a sample of 100 owners selected from a warm region, reflecting Sources of Variation inherent to sampling.

Snap & solve any problem in the app
Get step-by-step solutions on Sovi AI
Photo-based solutions with guided steps
Explore more problems and detailed explanations
To achieve an excellence-level understanding in your Statistical Investigation, here is the detailed breakdown of all five Sources of Variation contextualized within an Electric Vehicle (EV) dataset:
- Natural or Real Variation:
Inherent differences among individual EVs. For example, different vehicle models (e.g., Tesla Model 3 vs. Nissan Leaf) naturally possess different battery capacities, motor efficiencies, and weights, leading to different baseline ranges.
- Occasion-to-Occasion Variation:
Differences in measurements taken on the same EV at different times. For instance, a single EV's range will vary from day to day depending on seasonal temperatures (batteries perform worse in winter), traffic conditions, and whether the driver uses air conditioning.
- Measurement Variation:
Inaccuracies or differences in how data is recorded. This includes variations in how different charging stations measure energy delivered (kWh) or minor discrepancies in how the vehicle's onboard computer estimates the remaining battery percentage (State of Charge).
- Induced Variation:
Variation actively caused by external factors or experimental settings. For example, comparing the energy consumption of EVs driven in "Eco Mode" versus those driven in "Sport Mode," or comparing performance on highway routes versus urban stop-and-go routes.
- Sampling Variation:
The variation that occurs because we analyze a sample rather than the entire population of EVs. If you take a sample of 50 EVs from a registry, their average efficiency will differ slightly from another random sample of 50 EVs due to the random selection process.