QUESTION IMAGE
Question
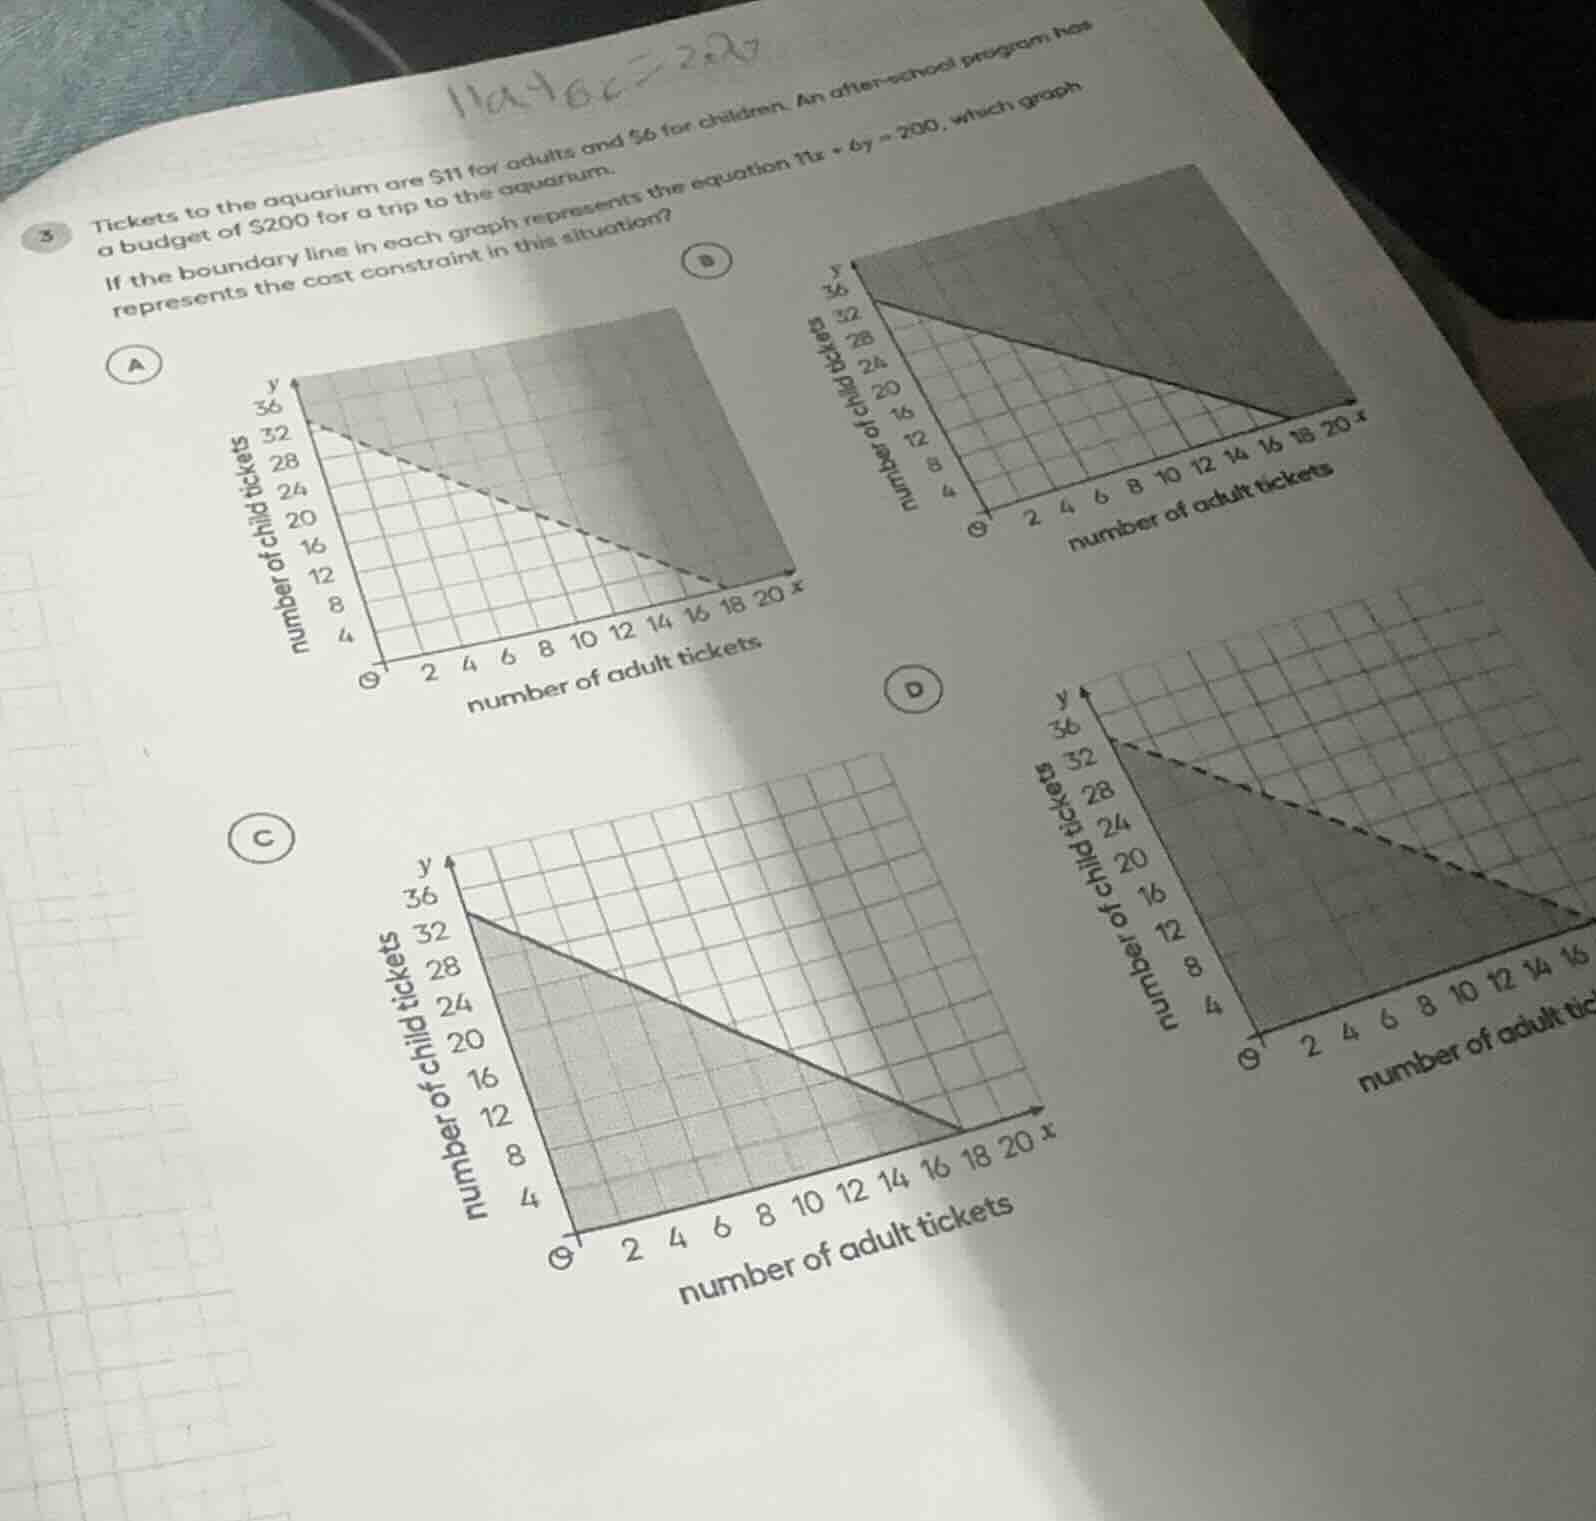
tickets to the aquarium are \\$11 for adults and \\$6 for children. an after-school program has a budget of \\$200 for a trip to the aquarium.
if the boundary line in each graph represents the equation \\(11x + 6y = 200\\), which graph represents the cost constraint in this situation?
Identify the constraint inequality
The problem states that tickets to the aquarium are \$11 for adults (LXI0) and \$6 for children (\(y\)).
The program has a budget of \$200.
This means the total cost must be less than or equal to \$200:
Find the boundary line intercepts
To graph the boundary line \(11x + 6y = 200\), we find the intercepts:
- For the \(y\)-intercept (\(x = 0\)):
- For the \(x\)-intercept (\(y = 0\)):
Determine the line type and shaded region
- Since the budget constraint is "at most \$200" (\(\le\)), the boundary line must be solid, and the shaded region must be below and to the left of the line (containing the origin \((0,0)\)).
- Looking at the options:
- A: Shaded region is above a dashed line.
- B: Shaded region is above a solid line.
- C: Shaded region is below a solid line, with \(y\)-intercept at approximately \(33.3\) and \(x\)-intercept at approximately \(18.2\).
- D: Shaded region is below a dashed line.
Therefore, option C correctly represents the cost constraint.

Snap & solve any problem in the app
Get step-by-step solutions on Sovi AI
Photo-based solutions with guided steps
Explore more problems and detailed explanations
- (A) Shaded region above a dashed line
- (B) Shaded region above a solid line
- (C) Shaded region below a solid line with y-intercept near 33.3 and x-intercept near 18.2 (Correct answer)
- (D) Shaded region below a dashed line