QUESTION IMAGE
Question
testing error vs tree depth
mse
depth
2
4
6
8
10
12
14
22
24
26
28
30
32
34
36
38
🆕 New Concept Discovered: Bias-Variance Tradeoff in Decision Trees
Finding the sweet spot between underfitting and overfitting.
Step 1: Understand the Axes
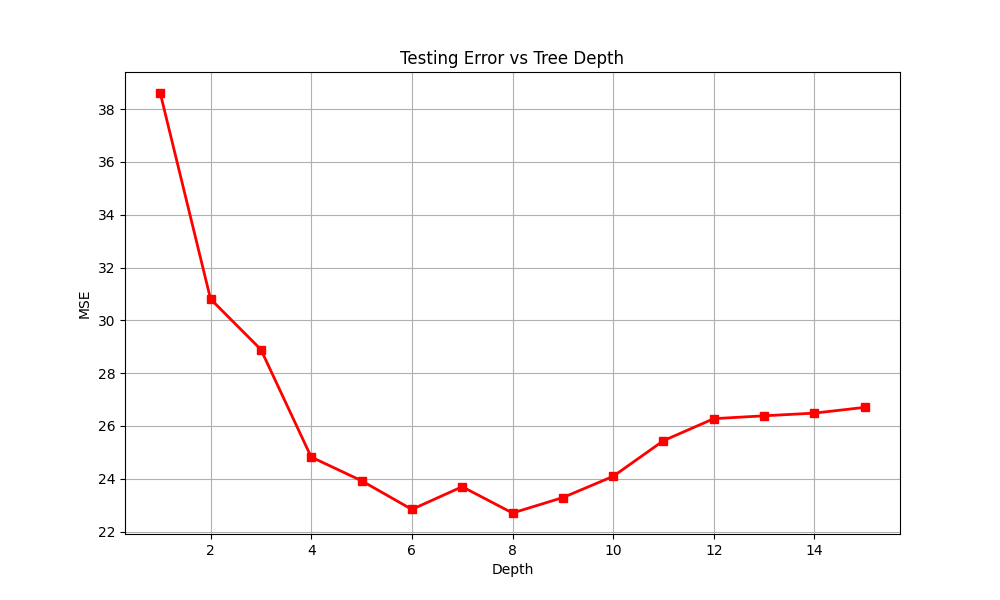
The graph plots Testing Error (MSE) on the y-axis against Tree Depth on the x-axis.
- MSE (Mean Squared Error) measures the average squared difference between the estimated values and the actual value. Lower MSE means better model performance.
- Tree Depth represents the complexity of the decision tree. A shallower tree (low depth) is simpler, while a deeper tree (high depth) is more complex.
Step 2: Analyze the Curve and Find the Minimum
To find the optimal tree depth, we look for the point where the testing error (MSE) is at its lowest. This represents the optimal balance where the model generalizes best to unseen test data:
- At very low depths (\(1\) to \(5\)), the MSE is high because the model is too simple to capture the underlying patterns (underfitting).
- As depth increases, the MSE decreases, reaching its lowest values around depths \(6\) to \(8\).
- Looking closely at the data points:
- At \(\text{Depth} = 6\), \(\text{MSE} \approx 22.9\)
- At \(\text{Depth} = 7\), \(\text{MSE} \approx 23.7\)
- At \(\text{Depth} = 8\), \(\text{MSE} \approx 22.7\) (the absolute lowest point on the curve)
- Beyond \(\text{Depth} = 8\), the testing error begins to rise again because the tree is becoming too complex and is fitting to the noise in the training data (overfitting).
The minimum testing error (MSE) occurs at a tree depth of 8.

Snap & solve any problem in the app
Get step-by-step solutions on Sovi AI
Photo-based solutions with guided steps
Explore more problems and detailed explanations
The optimal tree depth is 8, as it minimizes the testing Mean Squared Error (MSE) at approximately 22.7.