QUESTION IMAGE
Question
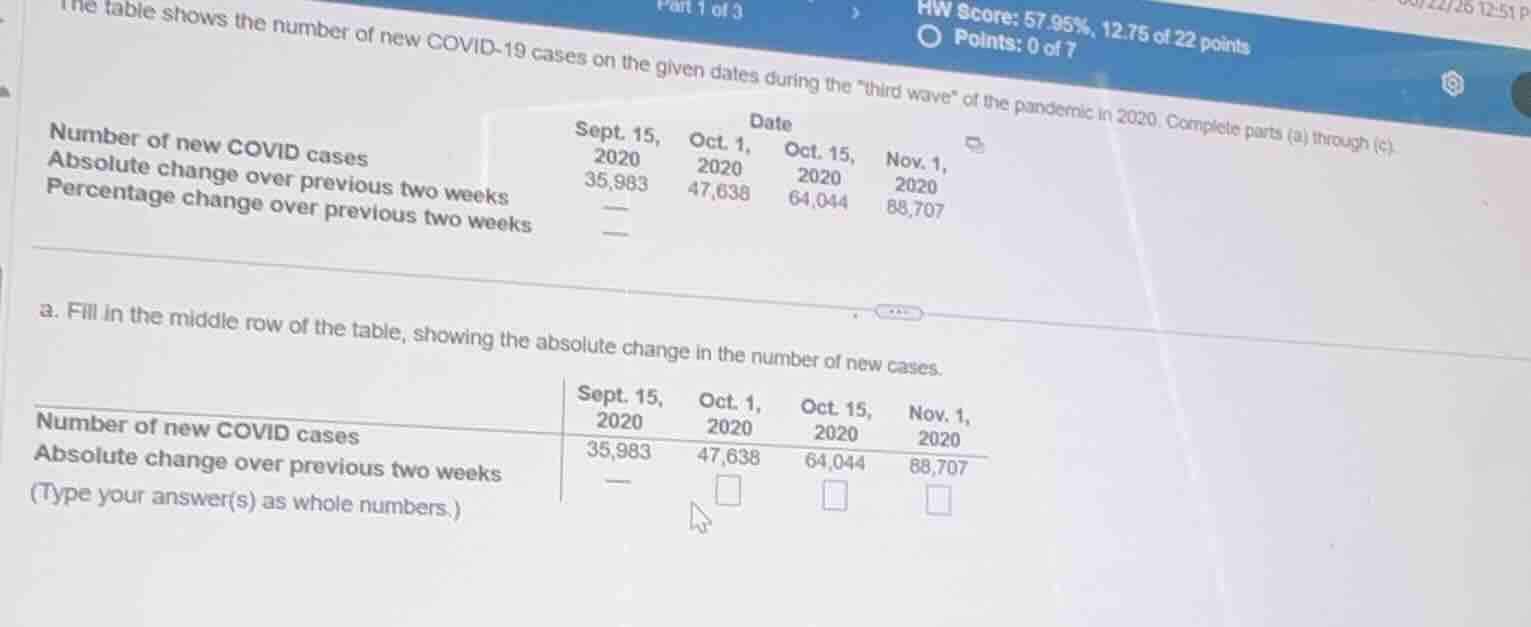
the table shows the number of new covid-19 cases on the given dates during the \third wave\ of the pandemic in 2020. complete parts (a) through (c).
\
$$\begin{tabular}{|l|c|c|c|c|}
\\hline
\\textbf{date} & sept. 15, 2020 & oct. 1, 2020 & oct. 15, 2020 & nov. 1, 2020 \\\\
\\hline
\\textbf{number of new covid cases} & 35,983 & 47,638 & 64,044 & 88,707 \\\\
\\hline
\\textbf{absolute change over previous two weeks} & — & & & \\\\
\\hline
\\textbf{percentage change over previous two weeks} & — & & & \\\\
\\hline
\\end{tabular}$$
a. fill in the middle row of the table, showing the absolute change in the number of new cases.
\
$$\begin{tabular}{|l|c|c|c|c|}
\\hline
\\textbf{date} & sept. 15, 2020 & oct. 1, 2020 & oct. 15, 2020 & nov. 1, 2020 \\\\
\\hline
\\textbf{number of new covid cases} & 35,983 & 47,638 & 64,044 & 88,707 \\\\
\\hline
\\textbf{absolute change over previous two weeks} & — & & & \\\\
\\hline
\\end{tabular}$$
(type your answer(s) as whole numbers.)
Calculate absolute change for Oct. 1, 2020
Using the Linear Growth knowledge point
$$
47638 - 35983 = 11655
$$
Calculate absolute change for Oct. 15, 2020
Using the Linear Growth knowledge point
$$
64044 - 47638 = 16406
$$
Calculate absolute change for Nov. 1, 2020
Using the Linear Growth knowledge point
$$
88707 - 64044 = 24663
$$

Snap & solve any problem in the app
Get step-by-step solutions on Sovi AI
Photo-based solutions with guided steps
Explore more problems and detailed explanations
Fill in the middle row of the table, showing the absolute change in the number of new cases.
| Date | Sept. 15, 2020 | Oct. 1, 2020 | Oct. 15, 2020 | Nov. 1, 2020 |
|---|---|---|---|---|
| Absolute change over previous two weeks | — | <blank>11655</blank> | <blank>16406</blank> | <blank>24663</blank> |