QUESTION IMAGE
Question
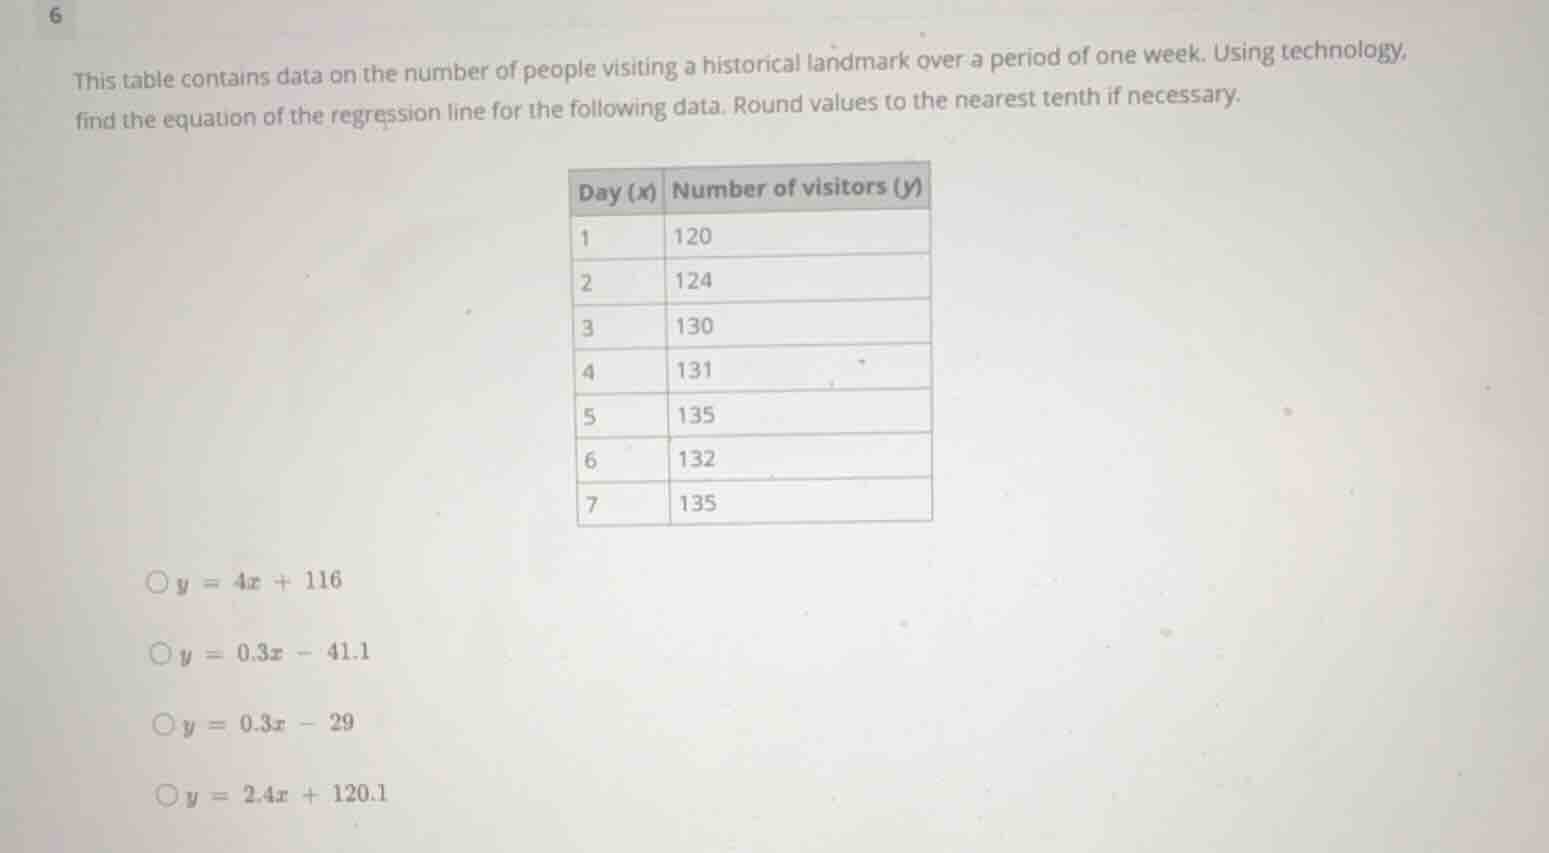
this table contains data on the number of people visiting a historical landmark over a period of one week. using technology, find the equation of the regression line for the following data. round values to the nearest tenth if necessary.
\
$$\begin{tabular}{|l|l|}
\\hline
day (x) & number of visitors (y) \\\\
\\hline
1 & 120 \\\\
\\hline
2 & 124 \\\\
\\hline
3 & 130 \\\\
\\hline
4 & 131 \\\\
\\hline
5 & 135 \\\\
\\hline
6 & 132 \\\\
\\hline
7 & 135 \\\\
\\hline
\\end{tabular}$$
\\(y = 4x + 116\\)
\\(y = 0.3x - 41.1\\)
\\(y = 0.3x - 29\\)
\\(y = 2.4x + 120.1\\)
Calculate summary statistics for the data points
$$
LATEXBLOCK0
$$
Compute the slope and y-intercept of the regression line
$$
LATEXBLOCK1
$$
Match with the given options
$$
y = 2.4x + 120.1
$$

Snap & solve any problem in the app
Get step-by-step solutions on Sovi AI
Photo-based solutions with guided steps
Explore more problems and detailed explanations
- (A) \(y = 4x + 116\)
- (B) \(y = 0.3x - 41.1\)
- (C) \(y = 0.3x - 29\)
- (D) \(y = 2.4x + 120.1\) (Correct answer)