QUESTION IMAGE
Question
study the who are americans? infographic, and then answer the question that follows.
which age groups experienced growth in their percentage of the u.s. population from 1900 to 2020, and which experienced a decline?
growing proportion of the u.s. population
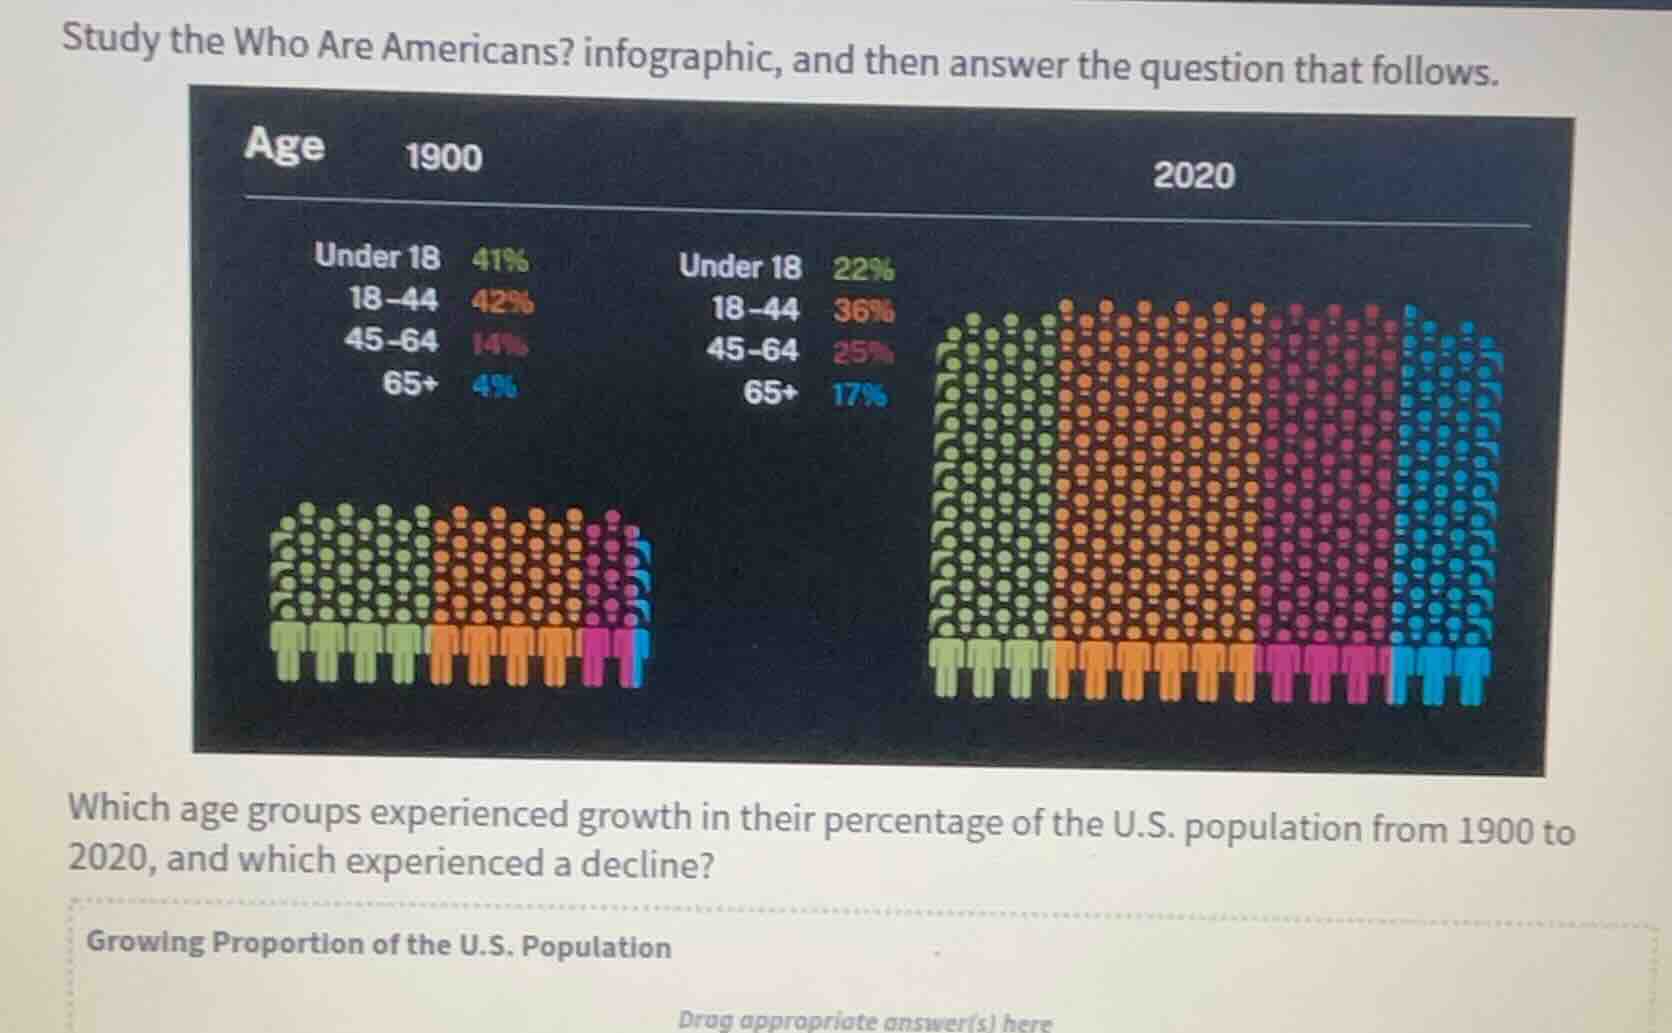
Compare age group percentages between 1900 and 2020
Compare the data points for each age group from the infographic:
- Under 18: Decreased from \(41\%\) in 1900 to \(22\%\) in 2020.
- 18–44: Decreased from \(42\%\) in 1900 to \(36\%\) in 2020.
- 45–64: Increased from \(14\%\) in 1900 to \(25\%\) in 2020.
- 65+: Increased from \(4\%\) in 1900 to \(17\%\) in 2020.
Categorize into growing and declining groups
- Growing Proportion: 45–64, 65+
- Declining Proportion: Under 18, 18–44

Snap & solve any problem in the app
Get step-by-step solutions on Sovi AI
Photo-based solutions with guided steps
Explore more problems and detailed explanations
Growing Proportion of the U.S. Population:
- 45–64
- 65+
Declining Proportion of the U.S. Population:
- Under 18
- 18–44