QUESTION IMAGE
Question
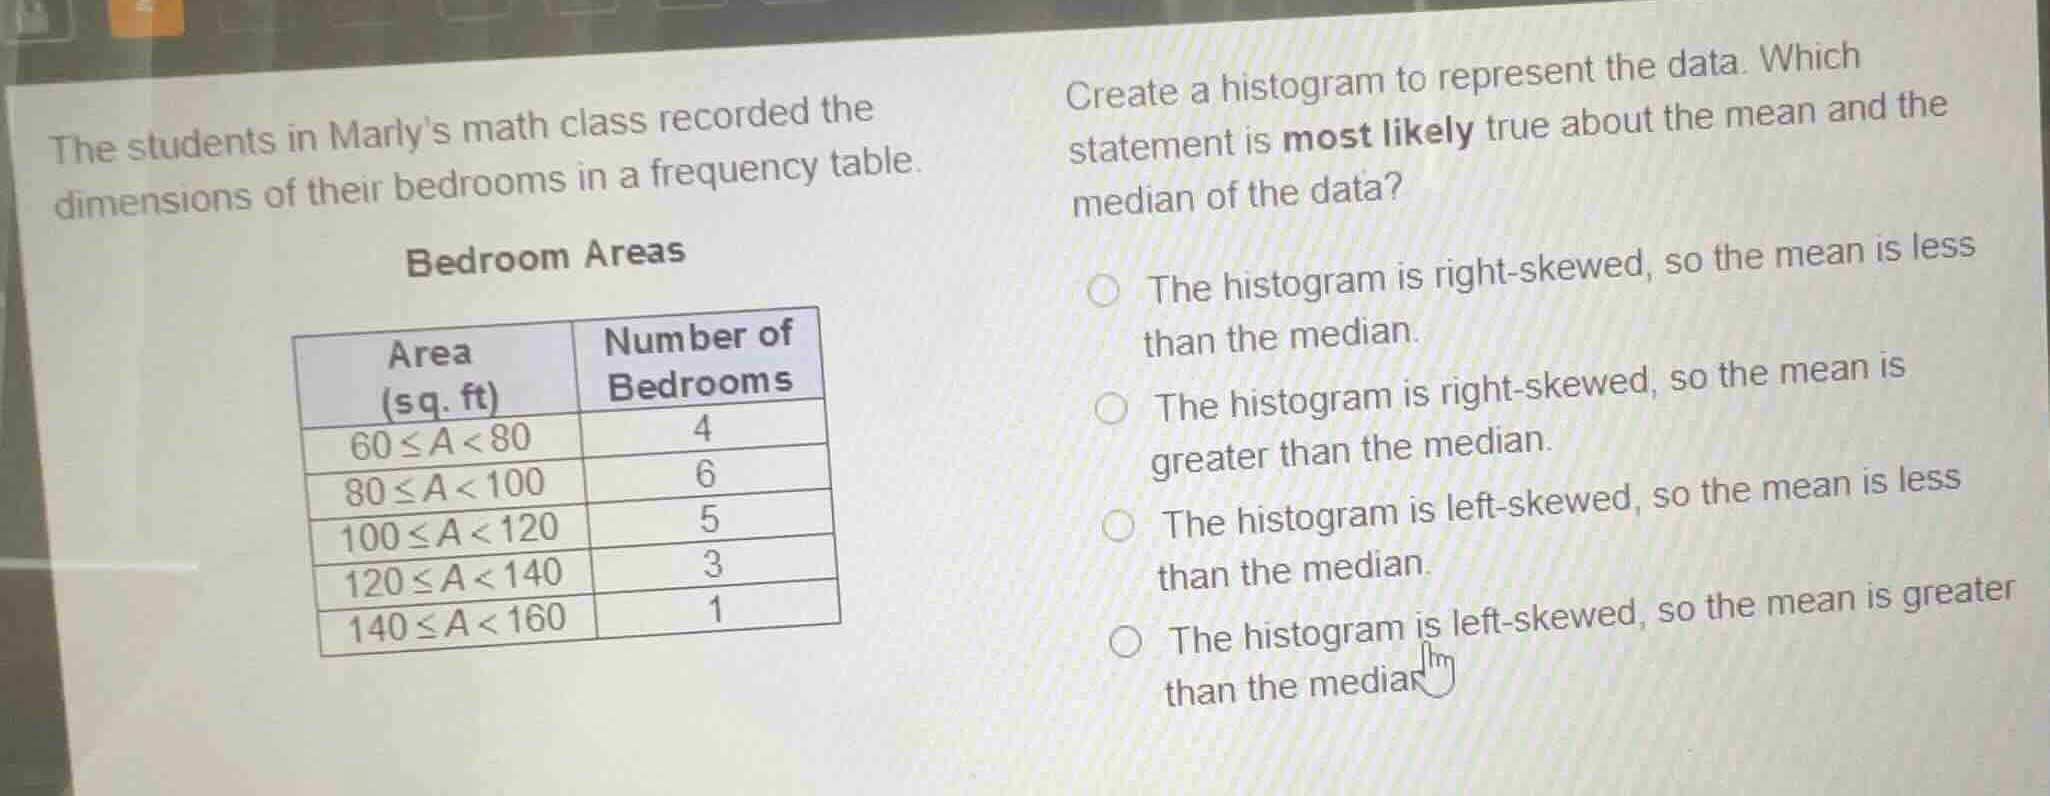
the students in marlys math class recorded the dimensions of their bedrooms in a frequency table.
bedroom areas
\
$$\begin{array}{|c|c|}
\\hline
\\text{area (sq. ft)} & \\text{number of bedrooms} \\\\
\\hline
60 \\le a < 80 & 4 \\\\
\\hline
80 \\le a < 100 & 6 \\\\
\\hline
100 \\le a < 120 & 5 \\\\
\\hline
120 \\le a < 140 & 3 \\\\
\\hline
140 \\le a < 160 & 1 \\\\
\\hline
\\end{array}$$
create a histogram to represent the data. which statement is most likely true about the mean and the median of the data?
- the histogram is right-skewed, so the mean is less than the median.
- the histogram is right-skewed, so the mean is greater than the median.
- the histogram is left-skewed, so the mean is less than the median.
- the histogram is left-skewed, so the mean is greater than the median.
Analyze the frequency distribution
The frequency of bedroom areas decreases as the area increases:
- \(60 \le A < 80\): 4
- \(80 \le A < 100\): 6 (peak)
- \(100 \le A < 120\): 5
- \(120 \le A < 140\): 3
- \(140 \le A < 160\): 1
Determine the shape of the distribution
The peak is on the left side (\(80 \le A < 100\)), and the tail extends to the right (larger values). This indicates a right-skewed distribution.
Compare the mean and median
In a right-skewed distribution, the mean is typically pulled toward the longer tail on the right, making the mean greater than the median.

Snap & solve any problem in the app
Get step-by-step solutions on Sovi AI
Photo-based solutions with guided steps
Explore more problems and detailed explanations
- The histogram is right-skewed, so the mean is less than the median.
- The histogram is right-skewed, so the mean is greater than the median. (Correct answer)
- The histogram is left-skewed, so the mean is less than the median.
- The histogram is left-skewed, so the mean is greater than the median.