QUESTION IMAGE
Question
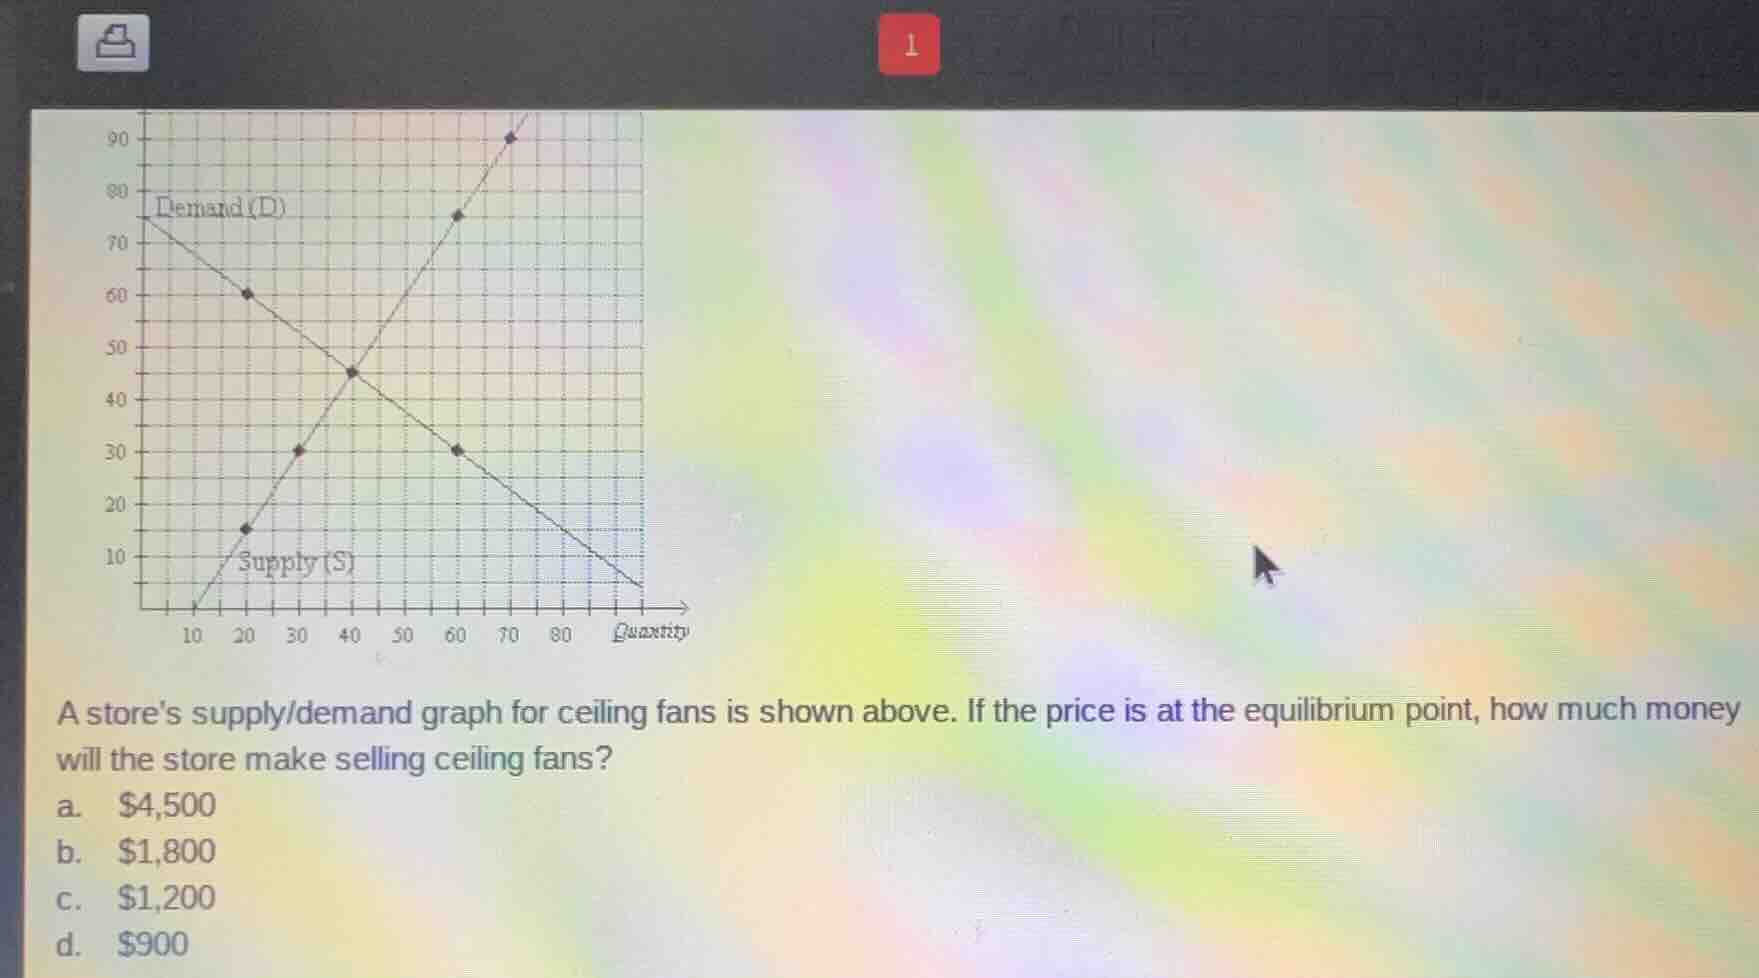
a stores supply/demand graph for ceiling fans is shown above. if the price is at the equilibrium point, how much money will the store make selling ceiling fans?
a. $4,500
b. $1,800
c. $1,200
d. $900
Find the equilibrium point
Using the Table Reading knowledge point, we locate the intersection of the Demand curve \(D\) and the Supply curve \(S\) on the graph. The two lines intersect at a single point, which represents the market equilibrium. Looking at the axes for this intersection point:
- The horizontal axis (Quantity) shows a value of \(40\).
- The vertical axis (Price in dollars) shows a value of \(45\).
Thus, the equilibrium quantity is \(Q = 40\) ceiling fans, and the equilibrium price is \(P = \$45\).
Calculate total revenue
To find how much money the store will make selling ceiling fans at this equilibrium point, we calculate the total revenue. Total revenue is the product of the price per unit and the quantity sold:
Substituting the values:
The store will make \(\$1,800\).

Snap & solve any problem in the app
Get step-by-step solutions on Sovi AI
Photo-based solutions with guided steps
Explore more problems and detailed explanations
- a. \$4,500
- b. \$1,800 (Correct answer)
- c. \$1,200
- d. \$900