QUESTION IMAGE
Question
select the correct answer.
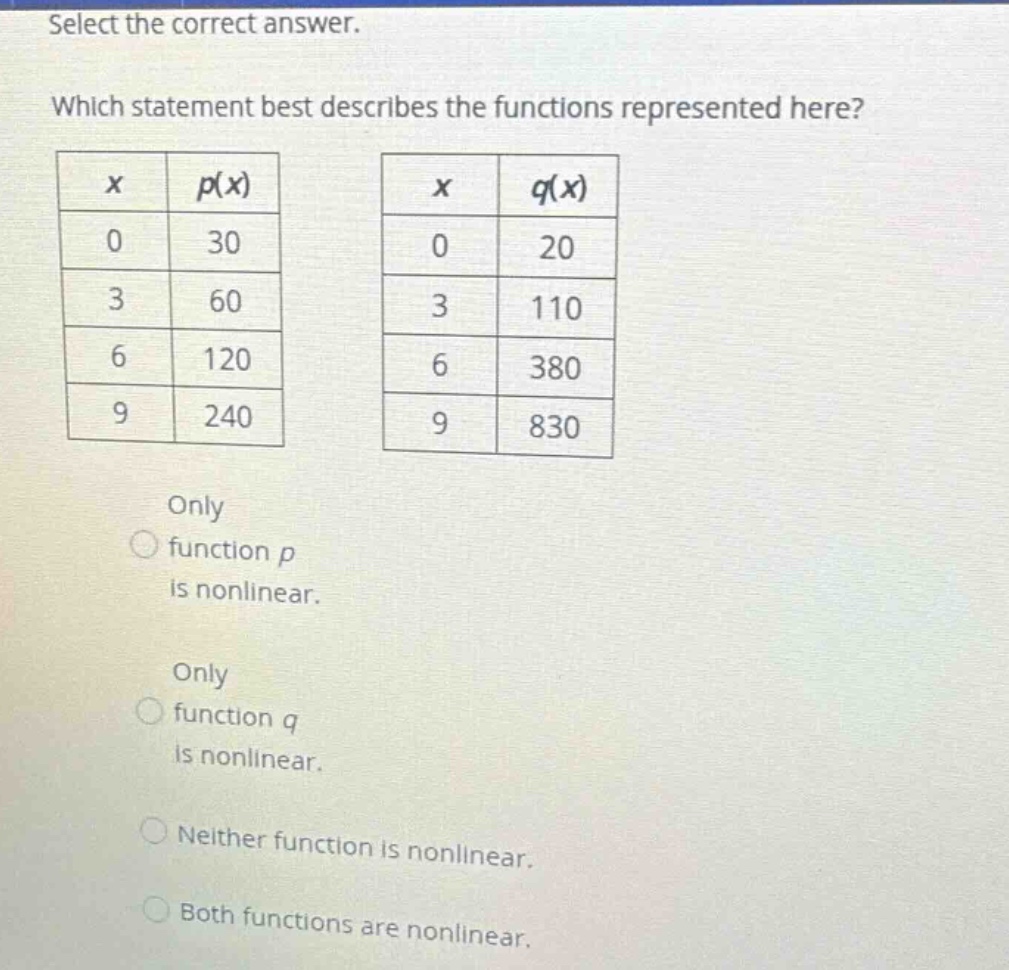
which statement best describes the functions represented here?
table 1:
\\(\
\\)
table 2:
\\(\
\\)
- only function \\(p\\) is nonlinear.
- only function \\(q\\) is nonlinear.
- neither function is nonlinear.
- both functions are nonlinear.
🆕 New Concept Discovered: Linear vs. Nonlinear Functions
How to tell if a table shows a straight line
Step 1: Check the rate of change for function \( p(x) \)
A function is linear if it has a constant rate of change (slope). We calculate the change in \( p(x) \) divided by the change in \( x \) between consecutive rows:
From \( x = 0 \) to \( x = 3 \):
From \( x = 3 \) to \( x = 6 \):
Since the rate of change is not constant (\( 10
eq 20 \)), function \( p \) is nonlinear.
Step 2: Check the rate of change for function \( q(x) \)
We calculate the rate of change between consecutive rows for \( q(x) \):
From \( x = 0 \) to \( x = 3 \):
From \( x = 3 \) to \( x = 6 \):
Since the rate of change is not constant (\( 30
eq 90 \)), function \( q \) is also nonlinear.
Step 3: Compare results with the given options
Both function \( p \) and function \( q \) have changing rates of change, which means neither graph is a straight line. Therefore, both functions are nonlinear.

Snap & solve any problem in the app
Get step-by-step solutions on Sovi AI
Photo-based solutions with guided steps
Explore more problems and detailed explanations
Both functions are nonlinear.