QUESTION IMAGE
Question
select the correct answer.
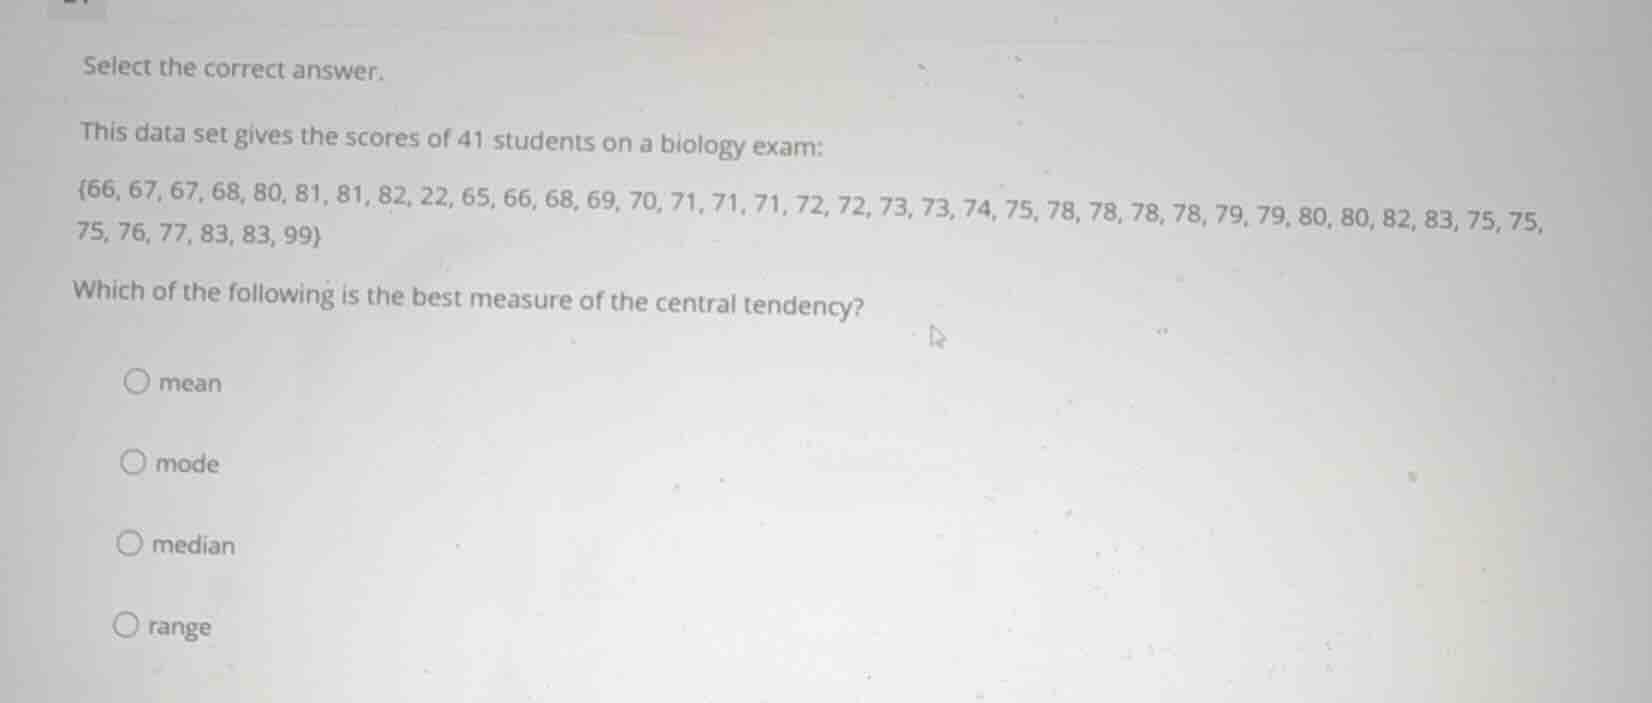
this data set gives the scores of 41 students on a biology exam:
\\{66, 67, 67, 68, 80, 81, 81, 82, 22, 65, 66, 68, 69, 70, 71, 71, 71, 72, 72, 73, 73, 74, 75, 78, 78, 78, 78, 79, 79, 80, 80, 82, 83, 75, 75, 75, 76, 77, 83, 83, 99\\}
which of the following is the best measure of the central tendency?
mean
mode
median
range
Analyze the distribution of the data set
The data set contains 41 exam scores:
Most values are clustered in the 60s, 70s, and 80s. However, there is an extreme low outlier at \(22\) and an extreme high outlier at \(99\).
Determine the effect of outliers on measures of central tendency
The mean is highly sensitive to extreme values (outliers), particularly the very low score of \(22\), which pulls the mean downward. The range is a measure of variability, not central tendency. The mode only represents the most frequent value but does not necessarily represent the center of the distribution. The median is resistant to outliers and provides the best measure of central tendency for skewed data or data sets with extreme outliers.

Snap & solve any problem in the app
Get step-by-step solutions on Sovi AI
Photo-based solutions with guided steps
Explore more problems and detailed explanations
- mean
- mode
- median (Correct answer)
- range