QUESTION IMAGE
Question
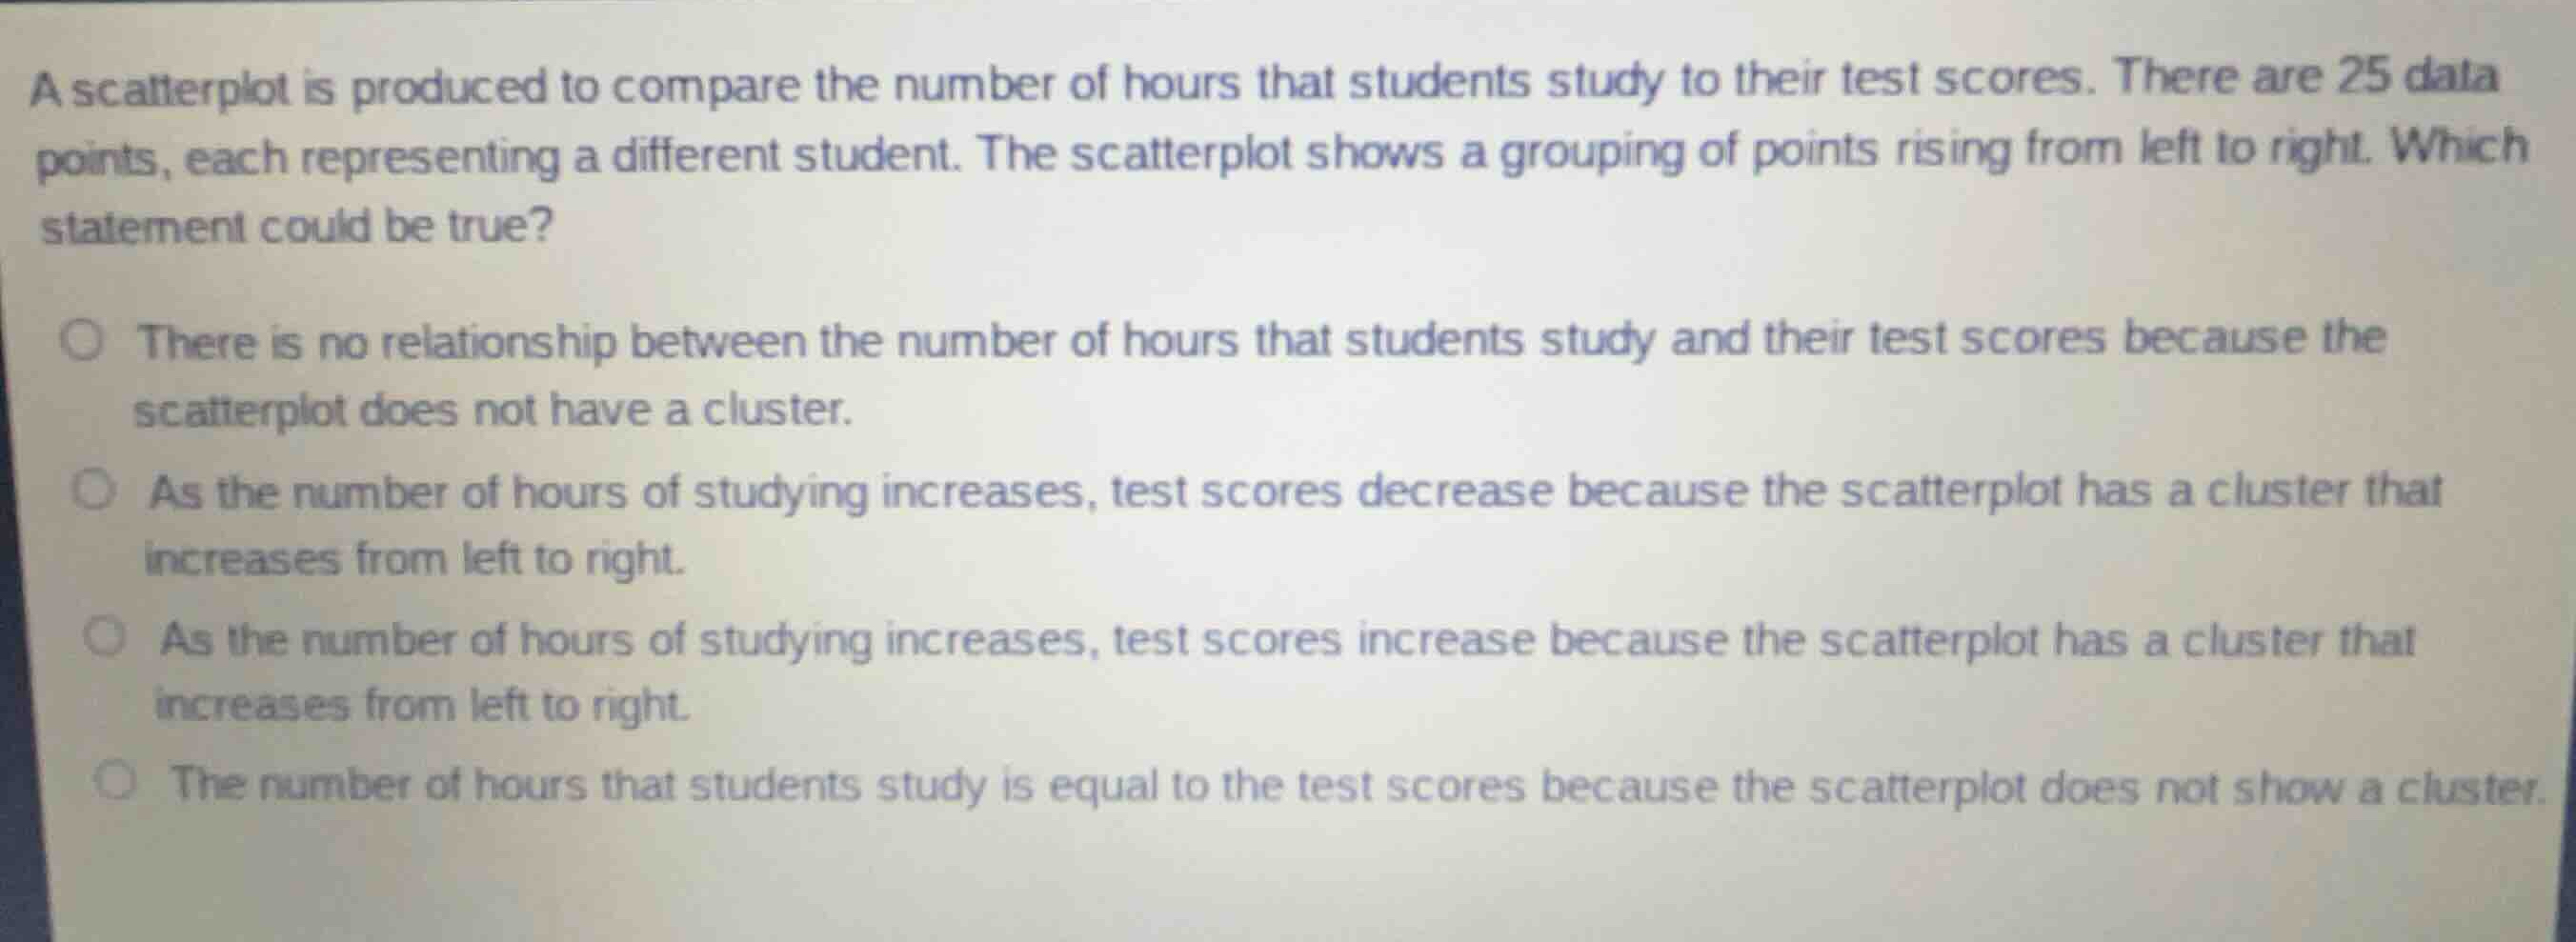
a scatterplot is produced to compare the number of hours that students study to their test scores. there are 25 data points, each representing a different student. the scatterplot shows a grouping of points rising from left to right. which statement could be true?
there is no relationship between the number of hours that students study and their test scores because the scatterplot does not have a cluster.
as the number of hours of studying increases, test scores decrease because the scatterplot has a cluster that increases from left to right.
as the number of hours of studying increases, test scores increase because the scatterplot has a cluster that increases from left to right.
the number of hours that students study is equal to the test scores because the scatterplot does not show a cluster.
Analyze the scatterplot description
The problem states that the scatterplot compares study hours (independent variable, horizontal axis) to test scores (dependent variable, vertical axis). It shows a grouping of points rising from left to right.
Interpret the rising pattern
A grouping of points rising from left to right indicates a positive association. This means that as the value on the horizontal axis (hours of studying) increases, the value on the vertical axis (test scores) also increases.
Evaluate the given options
- Option 1 suggests no relationship, which is incorrect because there is a clear rising pattern.
- Option 2 states that test scores decrease as study hours increase, which describes a falling pattern (negative association), not a rising one.
- Option 3 states that as study hours increase, test scores increase because the scatterplot has a cluster that increases from left to right. This matches the description perfectly.
- Option 4 states that study hours equal test scores, which is an incorrect interpretation of a general positive trend.

Snap & solve any problem in the app
Get step-by-step solutions on Sovi AI
Photo-based solutions with guided steps
Explore more problems and detailed explanations
- There is no relationship between the number of hours that students study and their test scores because the scatterplot does not have a cluster.
- As the number of hours of studying increases, test scores decrease because the scatterplot has a cluster that increases from left to right.
- As as the number of hours of studying increases, test scores increase because the scatterplot has a cluster that increases from left to right. (Correct answer)
- The number of hours that students study is equal to the test scores because the scatterplot does not show a cluster.