QUESTION IMAGE
Question
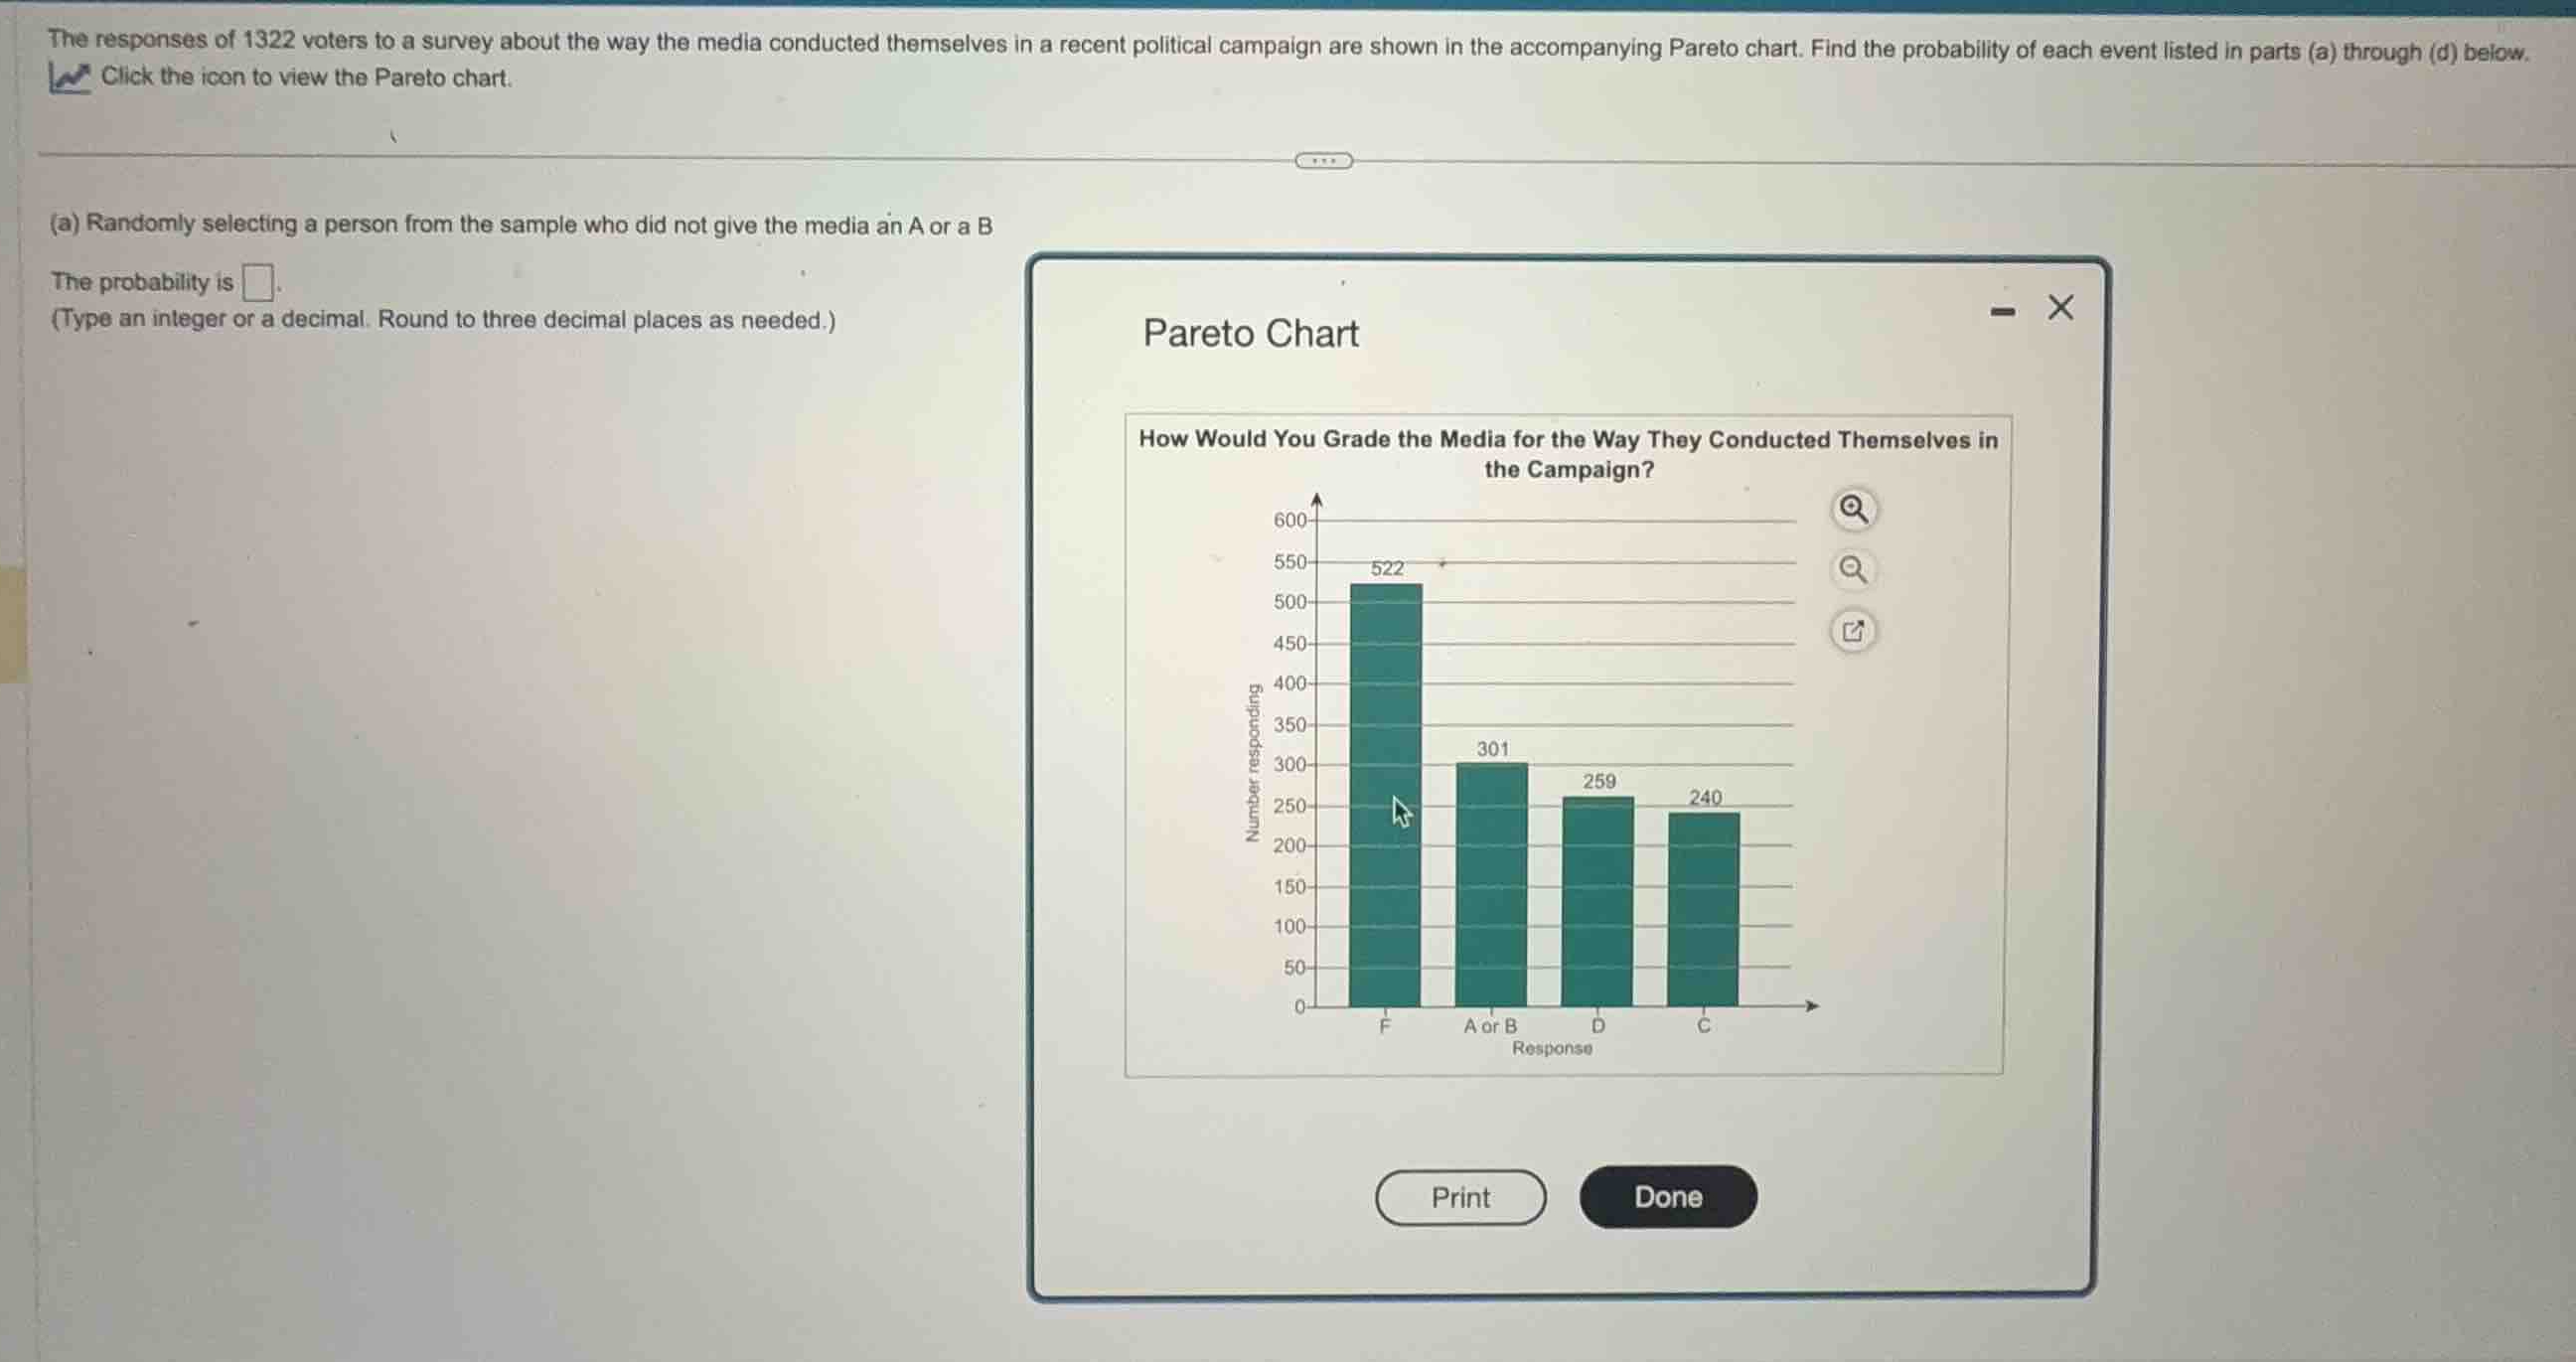
the responses of 1322 voters to a survey about the way the media conducted themselves in a recent political campaign are shown in the accompanying pareto chart. find the probability of each event listed in parts (a) through (d) below.
(a) randomly selecting a person from the sample who did not give the media an a or a b
the probability is \square.
(type an integer or a decimal. round to three decimal places as needed.)
Identify total sample size
Using the Pareto Chart knowledge point
The total number of surveyed voters is given in the problem statement:
Identify favorable outcomes
Using the Complementary Events and Pareto Chart knowledge points
We want to find the number of respondents who did not give the media an A or B.
From the Pareto chart, the number of respondents who gave an "A or B" is:
Therefore, the number of respondents who did not give an A or B is:
Calculate empirical probability
Using the Empirical Probability knowledge point
Round to three decimal places
Using the Empirical Probability knowledge point
Rounding \(0.7723147\) to three decimal places gives:

Snap & solve any problem in the app
Get step-by-step solutions on Sovi AI
Photo-based solutions with guided steps
Explore more problems and detailed explanations
(a) Randomly selecting a person from the sample who did not give the media an A or B
The probability is <blank>0.772</blank>.
(Type an integer or a decimal. Round to three decimal places as needed.)