QUESTION IMAGE
Question
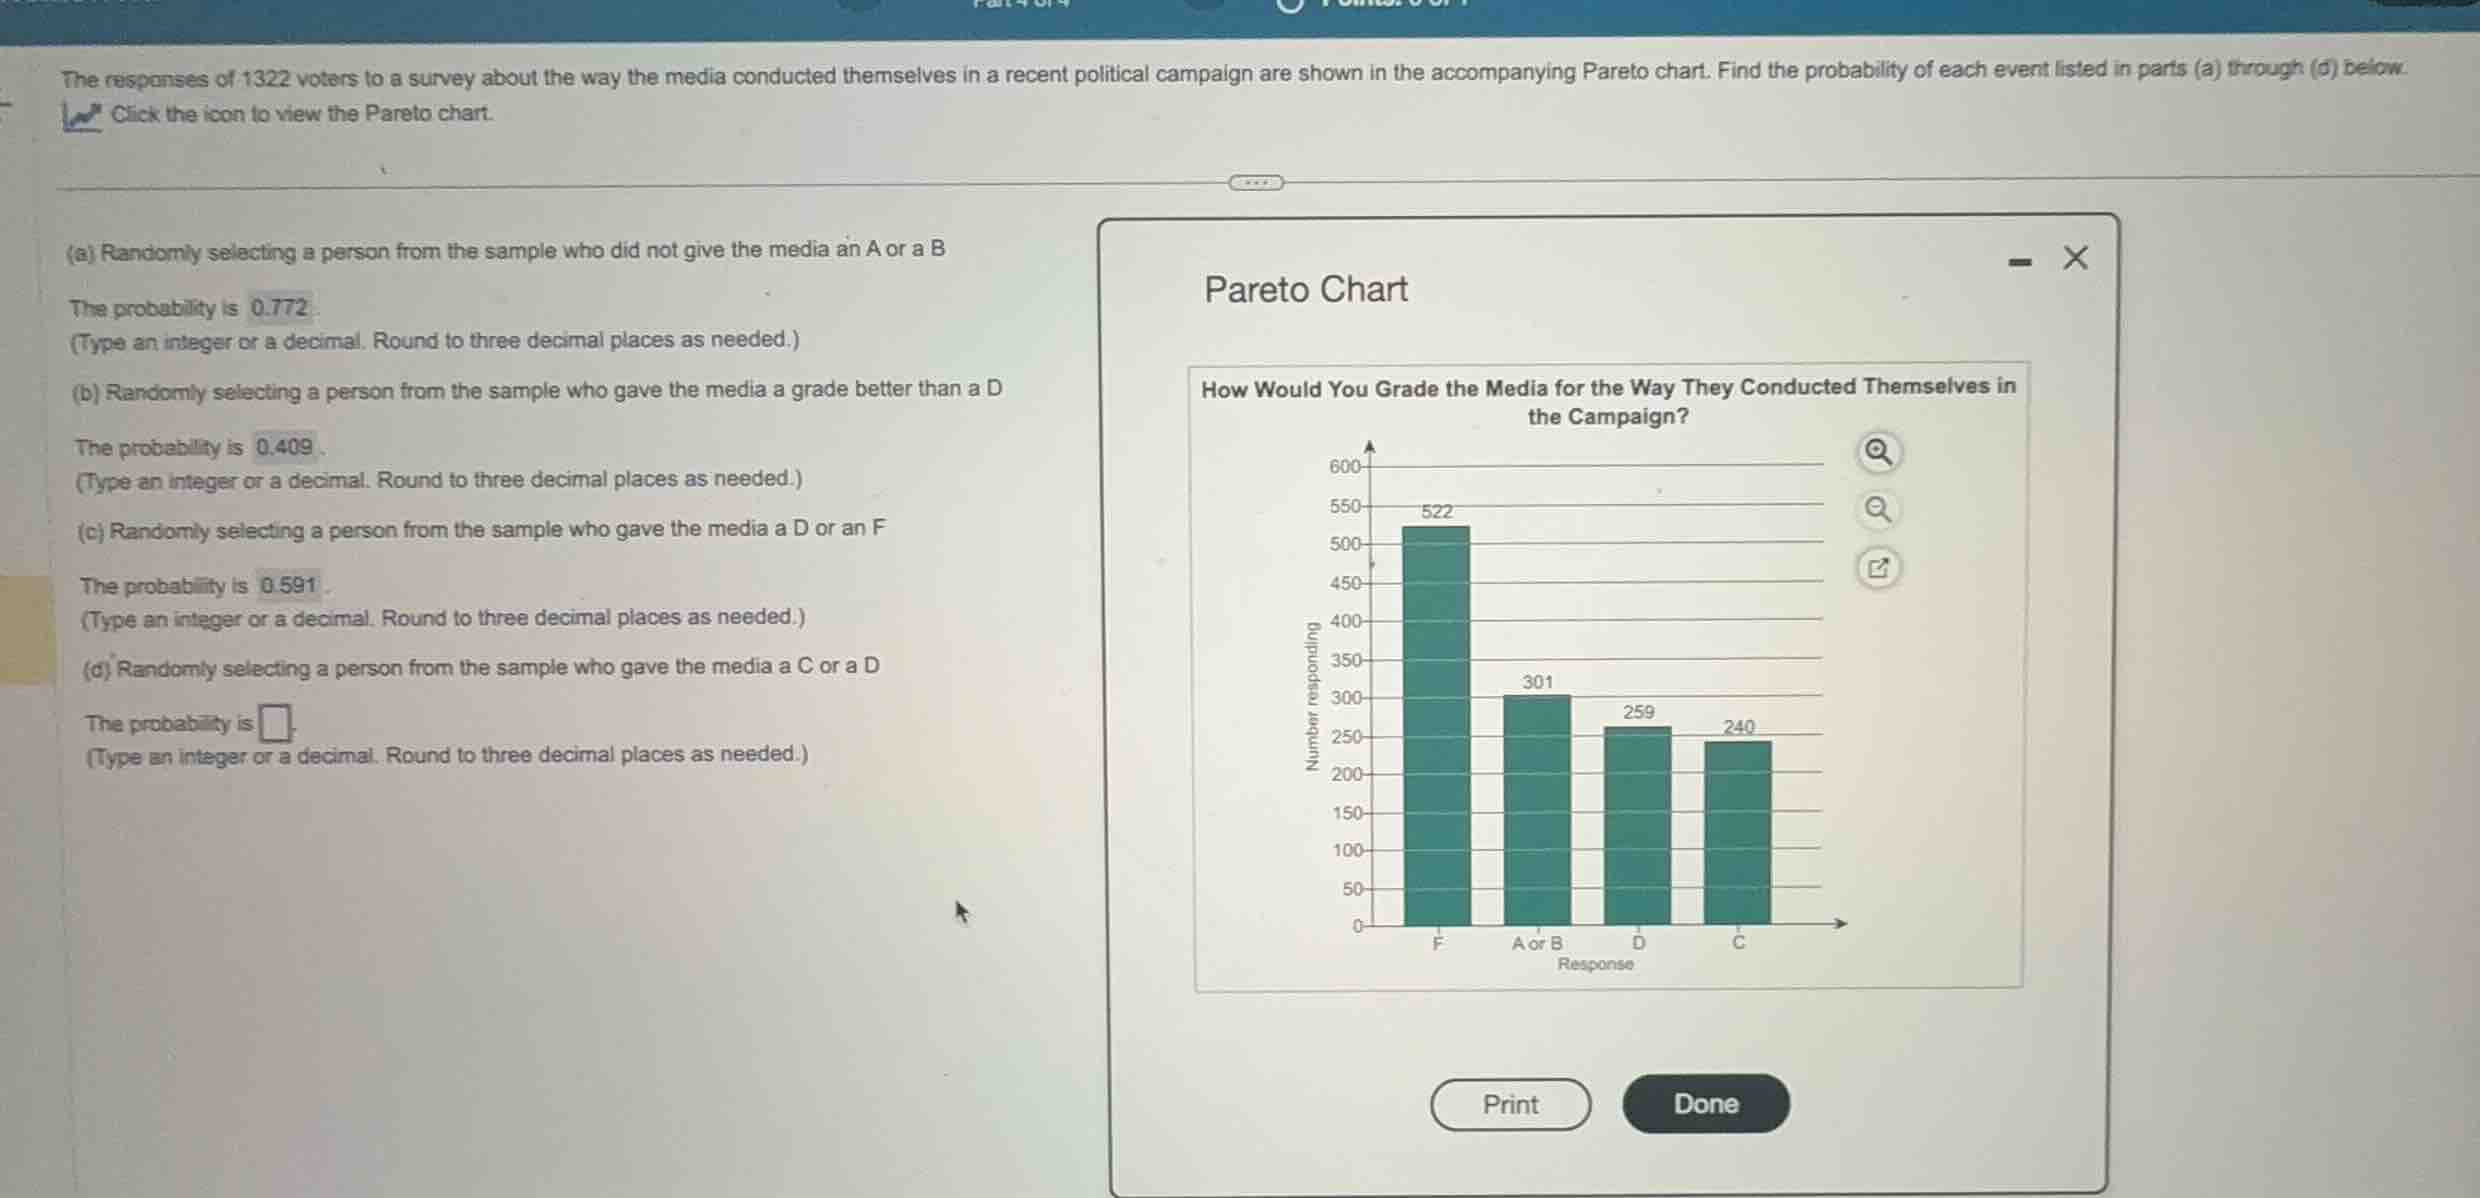
the responses of 1322 voters to a survey about the way the media conducted themselves in a recent political campaign are shown in the accompanying pareto chart. find the probability of each event listed in parts (a) through (d) below.
(a) randomly selecting a person from the sample who did not give the media an a or a b
the probability is 0.772
(type an integer or a decimal. round to three decimal places as needed.)
(b) randomly selecting a person from the sample who gave the media a grade better than a d
the probability is 0.409
(type an integer or a decimal. round to three decimal places as needed.)
(c) randomly selecting a person from the sample who gave the media a d or an f
the probability is 0.591
(type an integer or a decimal. round to three decimal places as needed.)
(d) randomly selecting a person from the sample who gave the media a c or a d
the probability is
(type an integer or a decimal. round to three decimal places as needed.)
Identify the given values
Using the Empirical Probability knowledge point
Calculate the target frequency
Using the Addition Rule for Probability and Mutually Exclusive Events knowledge points
Calculate the empirical probability
Using the Empirical Probability knowledge point
Round to three decimal places
Using the Empirical Probability knowledge point

Snap & solve any problem in the app
Get step-by-step solutions on Sovi AI
Photo-based solutions with guided steps
Explore more problems and detailed explanations
(d) Randomly selecting a person from the sample who gave the media a C or a D
The probability is <blank>0.377</blank>
(Type an integer or a decimal. Round to three decimal places as needed.)