QUESTION IMAGE
Question
representing and understanding data practice test
phase 1: easy levels (questions 1-6)
focus: reading graphs, calculating simple averages, and identifying basic features.
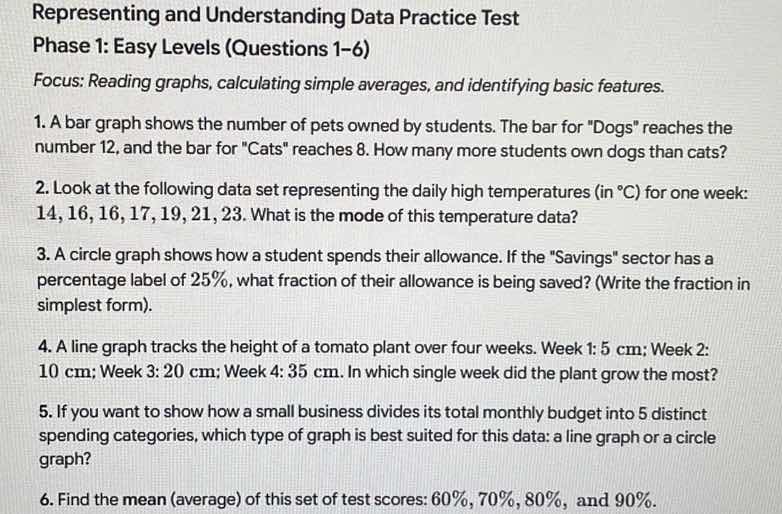
- a bar graph shows the number of pets owned by students. the bar for \dogs\ reaches the number 12, and the bar for \cats\ reaches 8. how many more students own dogs than cats?
- look at the following data set representing the daily high temperatures (in \\(^{\circ}\text{c}\\)) for one week: 14, 16, 16, 17, 19, 21, 23. what is the mode of this temperature data?
- a circle graph shows how a student spends their allowance. if the \savings\ sector has a percentage label of \\(25\\%\\), what fraction of their allowance is being saved? (write the fraction in simplest form).
- a line graph tracks the height of a tomato plant over four weeks. week 1: \\(5\text{ cm}\\); week 2: \\(10\text{ cm}\\); week 3: \\(20\text{ cm}\\); week 4: \\(35\text{ cm}\\). in which single week did the plant grow the most?
- if you want to show how a small business divides its total monthly budget into 5 distinct spending categories, which type of graph is best suited for this data: a line graph or a circle graph?
- find the mean (average) of this set of test scores: \\(60\\%\\), \\(70\\%\\), \\(80\\%\\), and \\(90\\%\\).
Calculate the difference in pet ownership
$$
12 - 8 = 4
$$
Identify the mode of the temperature data
$$
\text{Data: } 14, 16, 16, 17, 19, 21, 23 \implies \text{Mode} = 16
$$
Convert the percentage to a simplified fraction
$$
25\% = \frac{25}{100} = \frac{1}{4}
$$
Determine the weekly growth increments
$$
LATEXBLOCK0
$$
Select the best graph type for budget division
$$
\text{Division of a whole into categories} \implies \text{circle graph}
$$
Calculate the mean of the test scores
$$
\text{Mean} = \frac{60\% + 70\% + 80\% + 90\%}{4} = 75\%
$$

Snap & solve any problem in the app
Get step-by-step solutions on Sovi AI
Photo-based solutions with guided steps
Explore more problems and detailed explanations
| No. | Answer |
|---|---|
| 2 | 16 |
| 3 | \(\frac{1}{4}\) |
| 4 | Week 4 |
| 5 | circle graph |
| 6 | \(75\%\) |