QUESTION IMAGE
Question
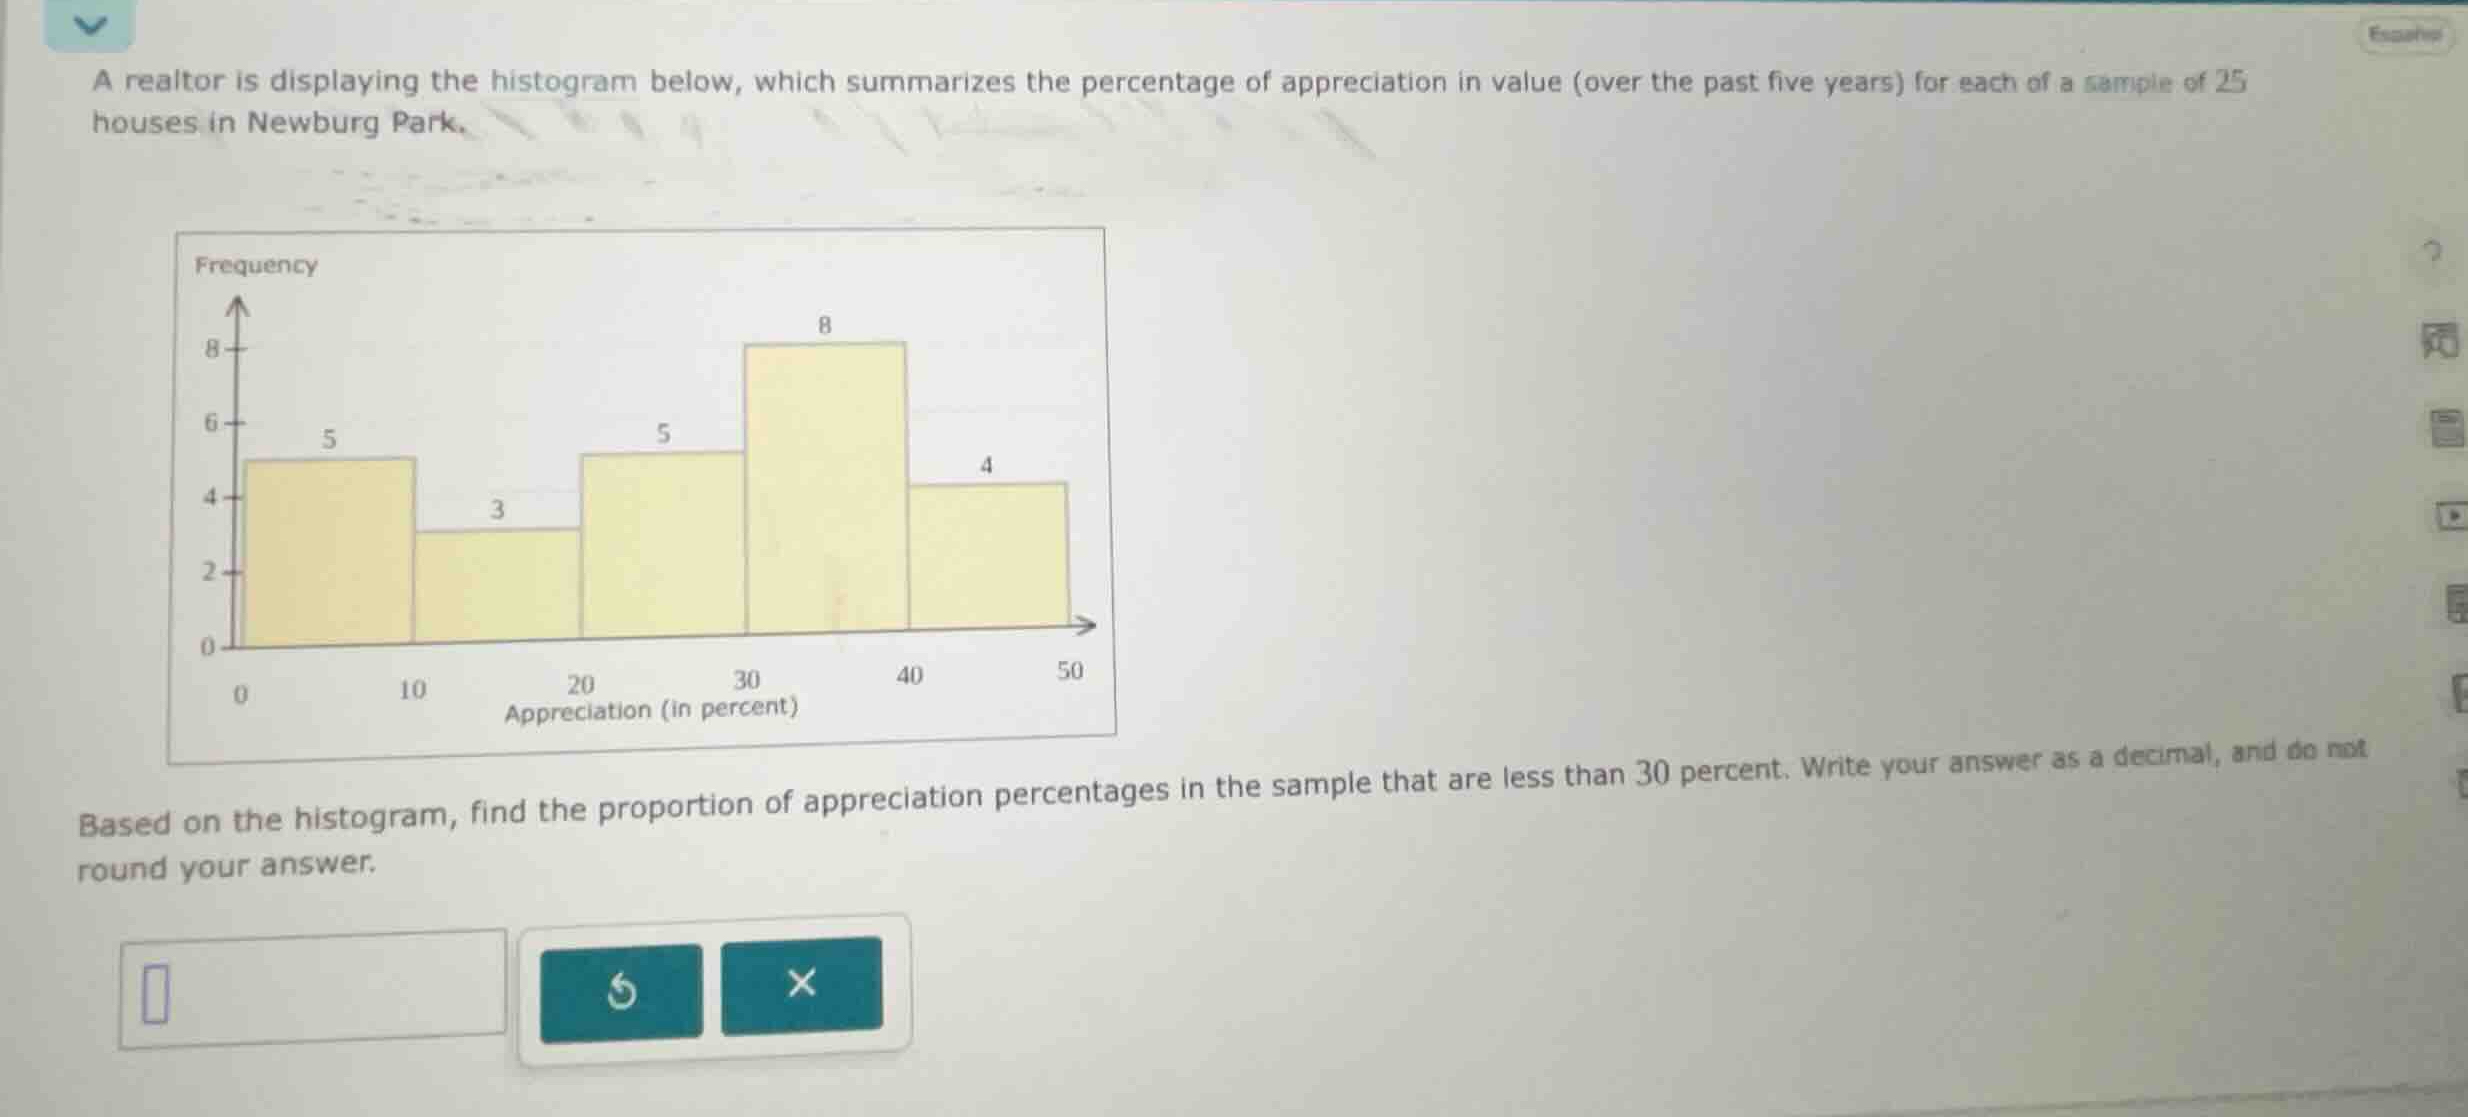
a realtor is displaying the histogram below, which summarizes the percentage of appreciation in value (over the past five years) for each of a sample of 25 houses in newburg park.
based on the histogram, find the proportion of appreciation percentages in the sample that are less than 30 percent. write your answer as a decimal, and do not round your answer.
Identify total sample size
Using the Descriptive Statistics knowledge point, we find the total number of houses in the sample, \(N\), by summing the frequencies of all bins in the histogram:
Sum frequencies below 30 percent
We identify the bins representing appreciation percentages less than \(30\%\). These are the bins spanning \(0-10\), \(10-20\), and \(20-30\). We sum their frequencies:
Calculate the proportion
We compute the proportion \(p\) by dividing the frequency of interest by the total sample size:

Snap & solve any problem in the app
Get step-by-step solutions on Sovi AI
Photo-based solutions with guided steps
Explore more problems and detailed explanations
Based on the histogram, find the proportion of appreciation percentages in the sample that are less than 30 percent. Write your answer as a decimal, and do not round your answer. <blank>0.52</blank>