QUESTION IMAGE
Question
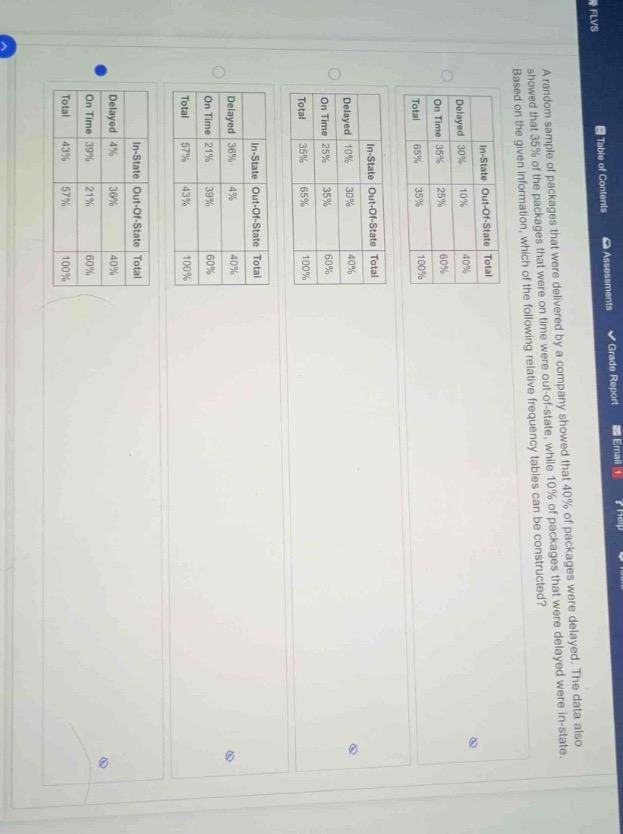
a random sample of packages that were delivered by a company showed that 40% of packages were delayed. the data also showed that 35% of the packages that were on time were out-of-state, while 10% of packages that were delayed were in-state. based on the given information, which of the following relative frequency tables can be constructed?
Identify the given marginal and conditional percentages
$$
LATEXBLOCK0
$$
Calculate the joint relative frequencies
$$
LATEXBLOCK1
$$
Determine the marginal totals for location and match the table
$$
LATEXBLOCK2
$$
The calculated values match the fourth table option (marked with the blue selection dot):
- Delayed & In-State: \(4\%\)
- Delayed & Out-of-State: \(36\%\)
- Delayed Total: \(40\%\)
- On Time & In-State: \(39\%\)
- On Time & Out-of-State: \(21\%\)
- On Time Total: \(60\%\)
- In-State Total: \(43\%\)
- Out-of-State Total: \(57\%\)
- Grand Total: \(100\%\)

Snap & solve any problem in the app
Get step-by-step solutions on Sovi AI
Photo-based solutions with guided steps
Explore more problems and detailed explanations
- (A) Table with: Delayed In-State 30%, Delayed Out-of-State 10%, Delayed Total 40%; On Time In-State 35%, On Time Out-of-State 25%, On Time Total 60%
- (B) Table with: Delayed In-State 10%, Delayed Out-of-State 30%, Delayed Total 40%; On Time In-State 25%, On Time Out-of-State 35%, On Time Total 60%
- (C) Table with: Delayed In-State 36%, Delayed Out-of-State 4%, Delayed Total 40%; On Time In-State 21%, On Time Out-of-State 39%, On Time Total 60%
- (D) Table with: Delayed In-State 4%, Delayed Out-of-State 36%, Delayed Total 40%; On Time In-State 39%, On Time Out-of-State 21%, On Time Total 60% (Correct answer)