QUESTION IMAGE
Question
question 9 points 3
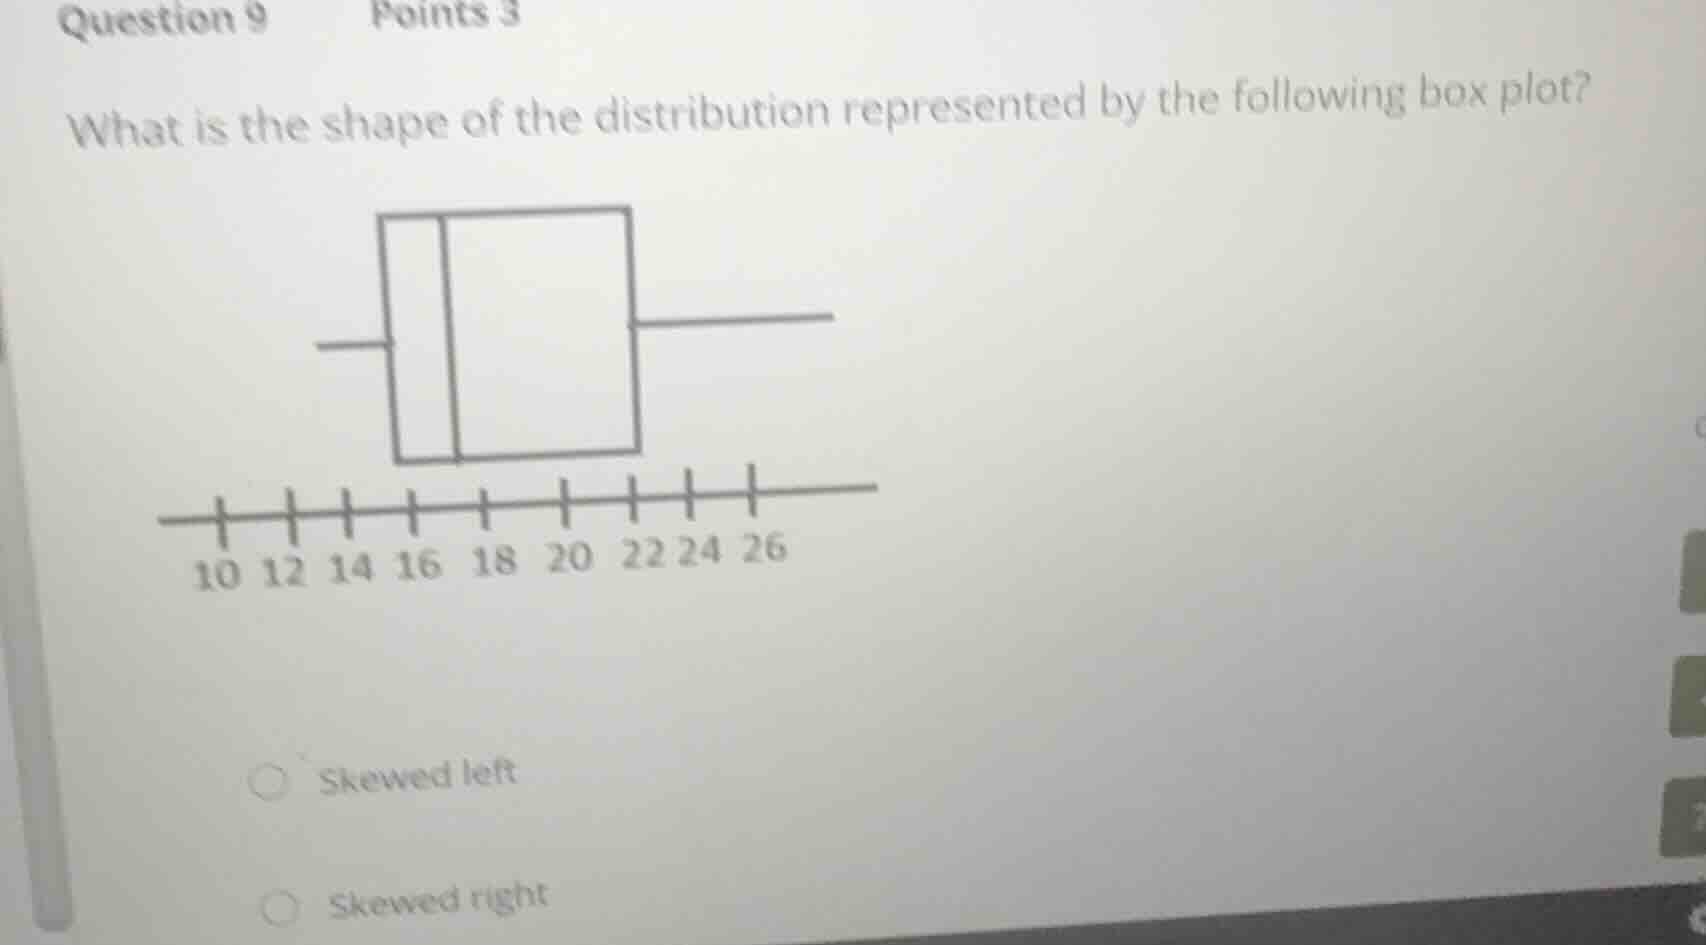
what is the shape of the distribution represented by the following box plot?
skewed left
skewed right
Identify key values from the box plot
Using the Box Plot Symmetry and Data Distribution Shape knowledge points
- Minimum value: \(13\)
- First quartile \(Q_1\): \(16\)
- Median \(Q_2\): \(17\)
- Third quartile \(Q_3\): \(22\)
- Maximum value: \(26\)
Analyze the skewness of the distribution
Using the Data Distribution Shape knowledge point
- Left side of the box: \(Q_2 - Q_1 = 17 - 16 = 1\)
- Right side of the box: \(Q_3 - Q_2 = 22 - 17 = 5\)
- Left whisker length: \(Q_1 - \text{Min} = 16 - 13 = 3\)
- Right whisker length: \(\text{Max} - Q_3 = 26 - 22 = 4\)
- The right side of the box is significantly wider than the left side, and the right whisker is longer than the left whisker, indicating a longer tail to the right. Thus, the distribution is skewed right.

Snap & solve any problem in the app
Get step-by-step solutions on Sovi AI
Photo-based solutions with guided steps
Explore more problems and detailed explanations
- Skewed left
- Skewed right (Correct answer)