QUESTION IMAGE
Question
question 9 (1 point)
solve the problem.
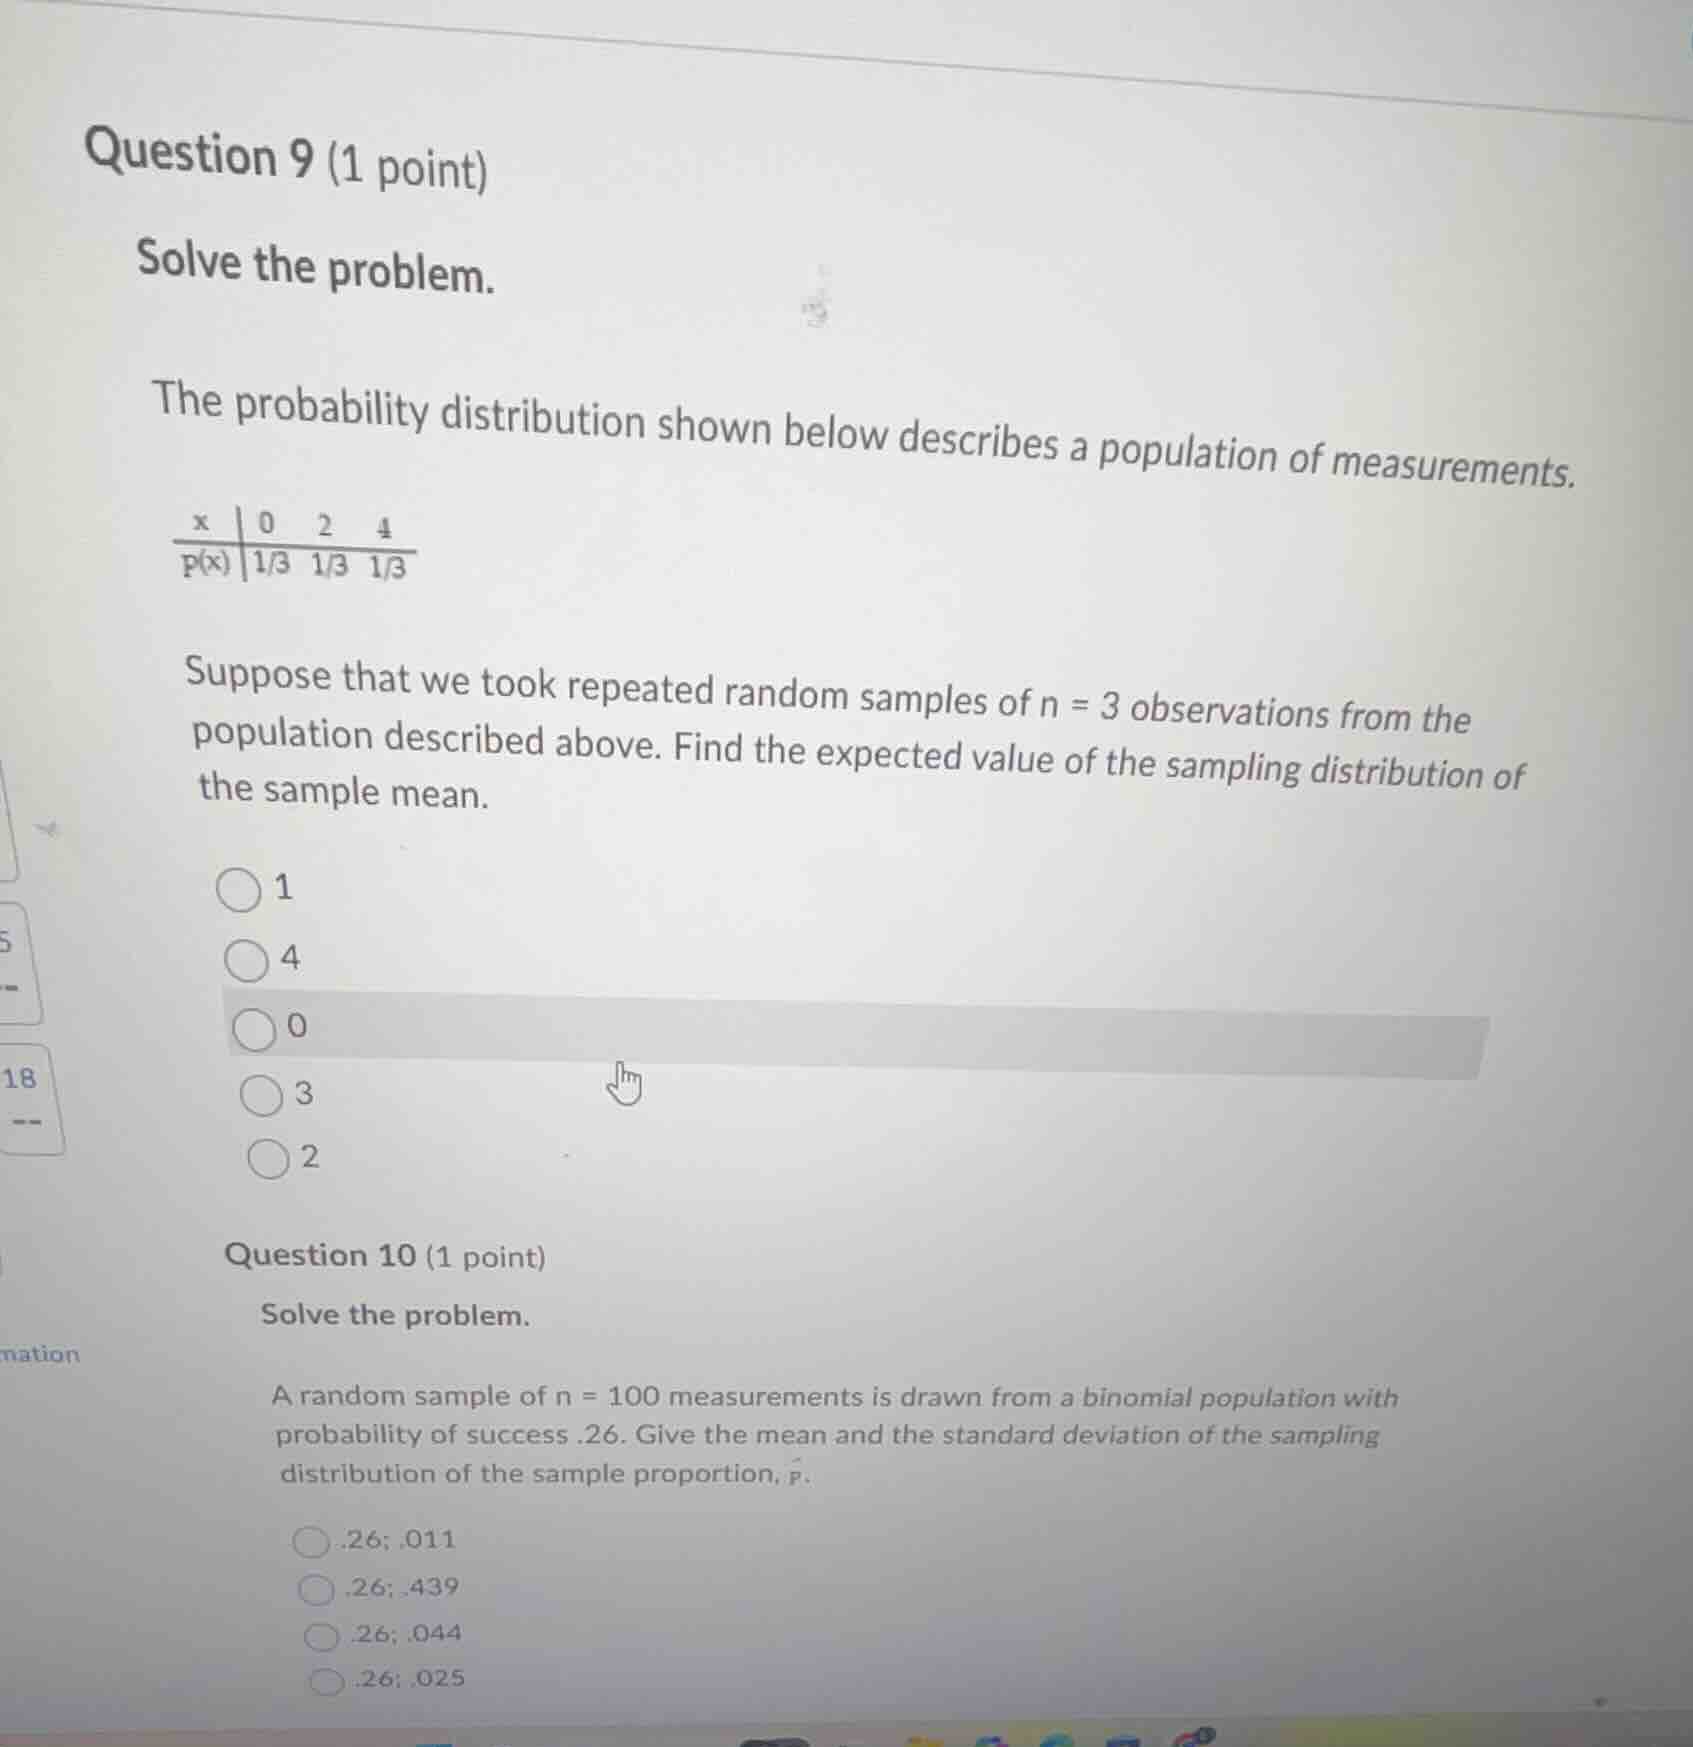
the probability distribution shown below describes a population of measurements.
\\(\
\\)
suppose that we took repeated random samples of \\(n = 3\\) observations from the population described above. find the expected value of the sampling distribution of the sample mean.
( ) 1
( ) 4
( ) 0
( ) 3
( ) 2
question 10 (1 point)
solve the problem.
a random sample of \\(n = 100\\) measurements is drawn from a binomial population with probability of success .26. give the mean and the standard deviation of the sampling distribution of the sample proportion, \\(\hat{p}\\).
( ) .26; .011
( ) .26; .439
( ) .26; .044
( ) .26; .025
Calculate the population mean
Using the Discrete Probability Distribution knowledge point
Find the expected value of the sample mean
Using the Sampling Distribution knowledge point
Calculate the mean of the sample proportion
For Question 10, the mean of the sampling distribution of the sample proportion \(\hat{p}\) is equal to the population proportion \(p\).
Given:
Therefore:
Calculate the standard deviation of the sample proportion
The standard deviation (standard error) of the sampling distribution of the sample proportion \(\hat{p}\) is:
Rounding to three decimal places gives \(0.044\).

Snap & solve any problem in the app
Get step-by-step solutions on Sovi AI
Photo-based solutions with guided steps
Explore more problems and detailed explanations
Question 9
- 1
- 4
- 0
- 3
- 2 (Correct answer)
Question 10
- .26; .011
- .26; .439
- .26; .044 (Correct answer)
- .26; .025