QUESTION IMAGE
Question
question 3 of 25
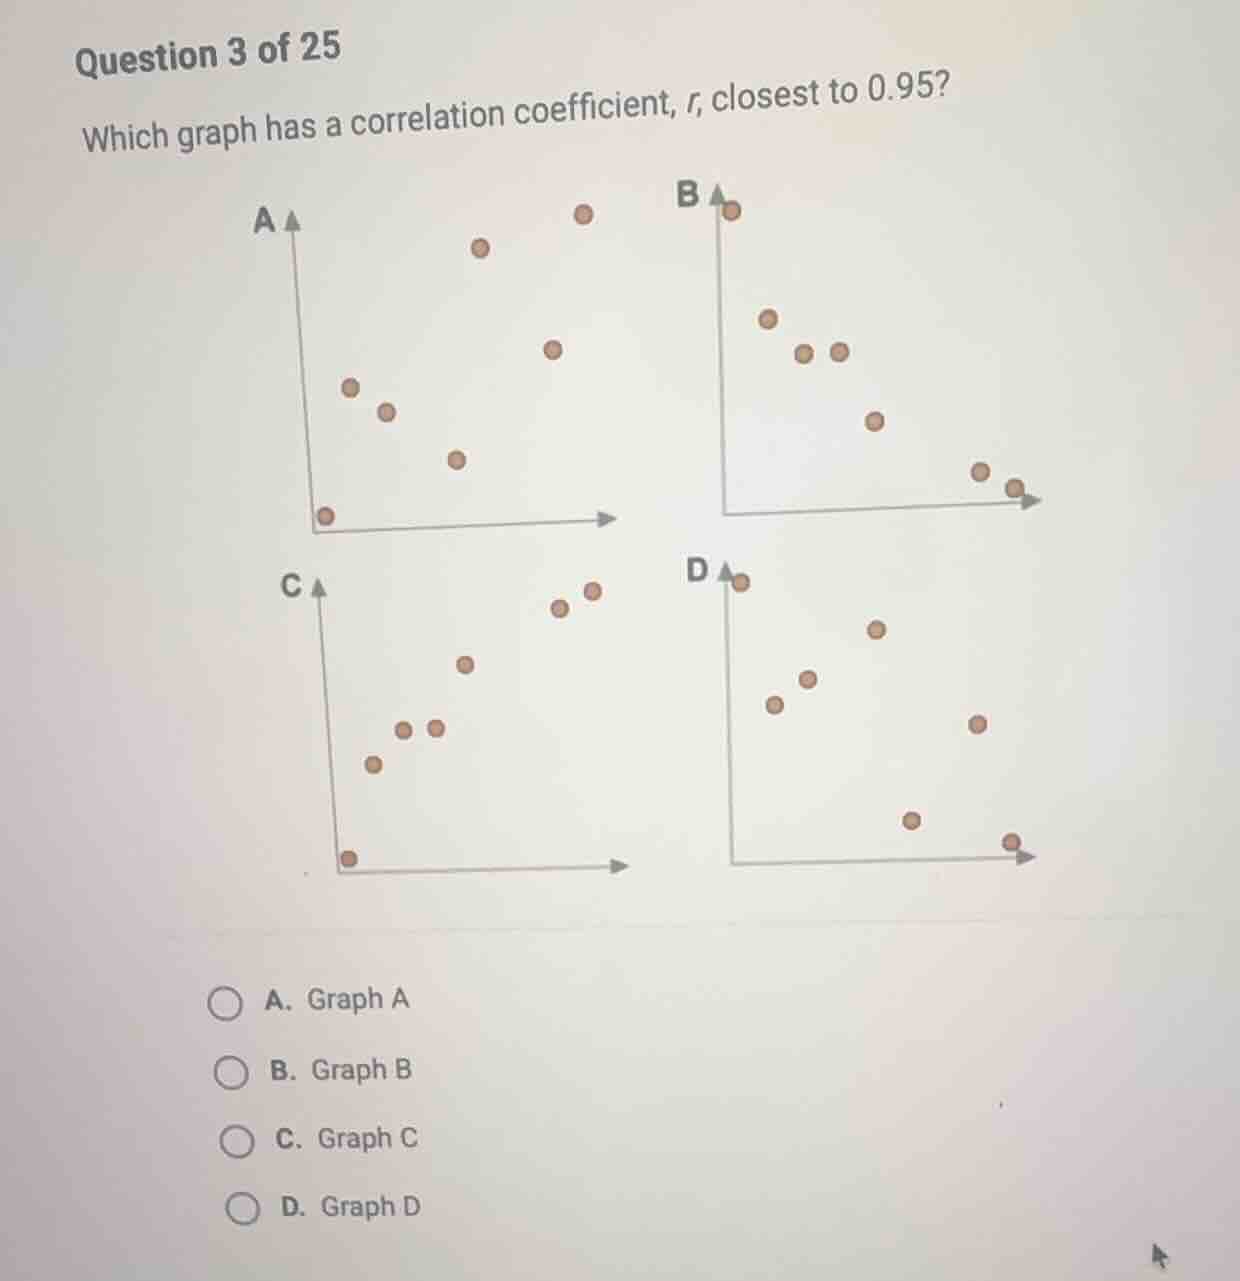
which graph has a correlation coefficient, \\(r\\), closest to 0.95?
a. graph a
b. graph b
c. graph c
d. graph d
Analyze the sign of the correlation coefficient
A correlation coefficient of \(r \approx 0.95\) indicates a strong, positive linear relationship. This means as the horizontal variable increases, the vertical variable also increases, showing an upward trend from left to right.
- Graphs A and C show positive trends.
- Graphs B and D show negative trends (\(r < 0\)).
Compare the strength of positive trends
We compare the positive-trending scatter plots, Graph A and Graph C, to see which is closer to a perfect straight line (\(r = 1\)).
- Graph A shows a weak or non-linear positive trend with significant scatter.
- Graph C shows a very tight, highly linear upward pattern.
Determine the closest graph
Because the points in Graph C lie very close to a straight line with a positive slope, its correlation coefficient \(r\) is closest to \(0.95\).

Snap & solve any problem in the app
Get step-by-step solutions on Sovi AI
Photo-based solutions with guided steps
Explore more problems and detailed explanations
- A. Graph A
- B. Graph B
- C. Graph C (Correct answer)
- D. Graph D