QUESTION IMAGE
Question
question 16 of 25
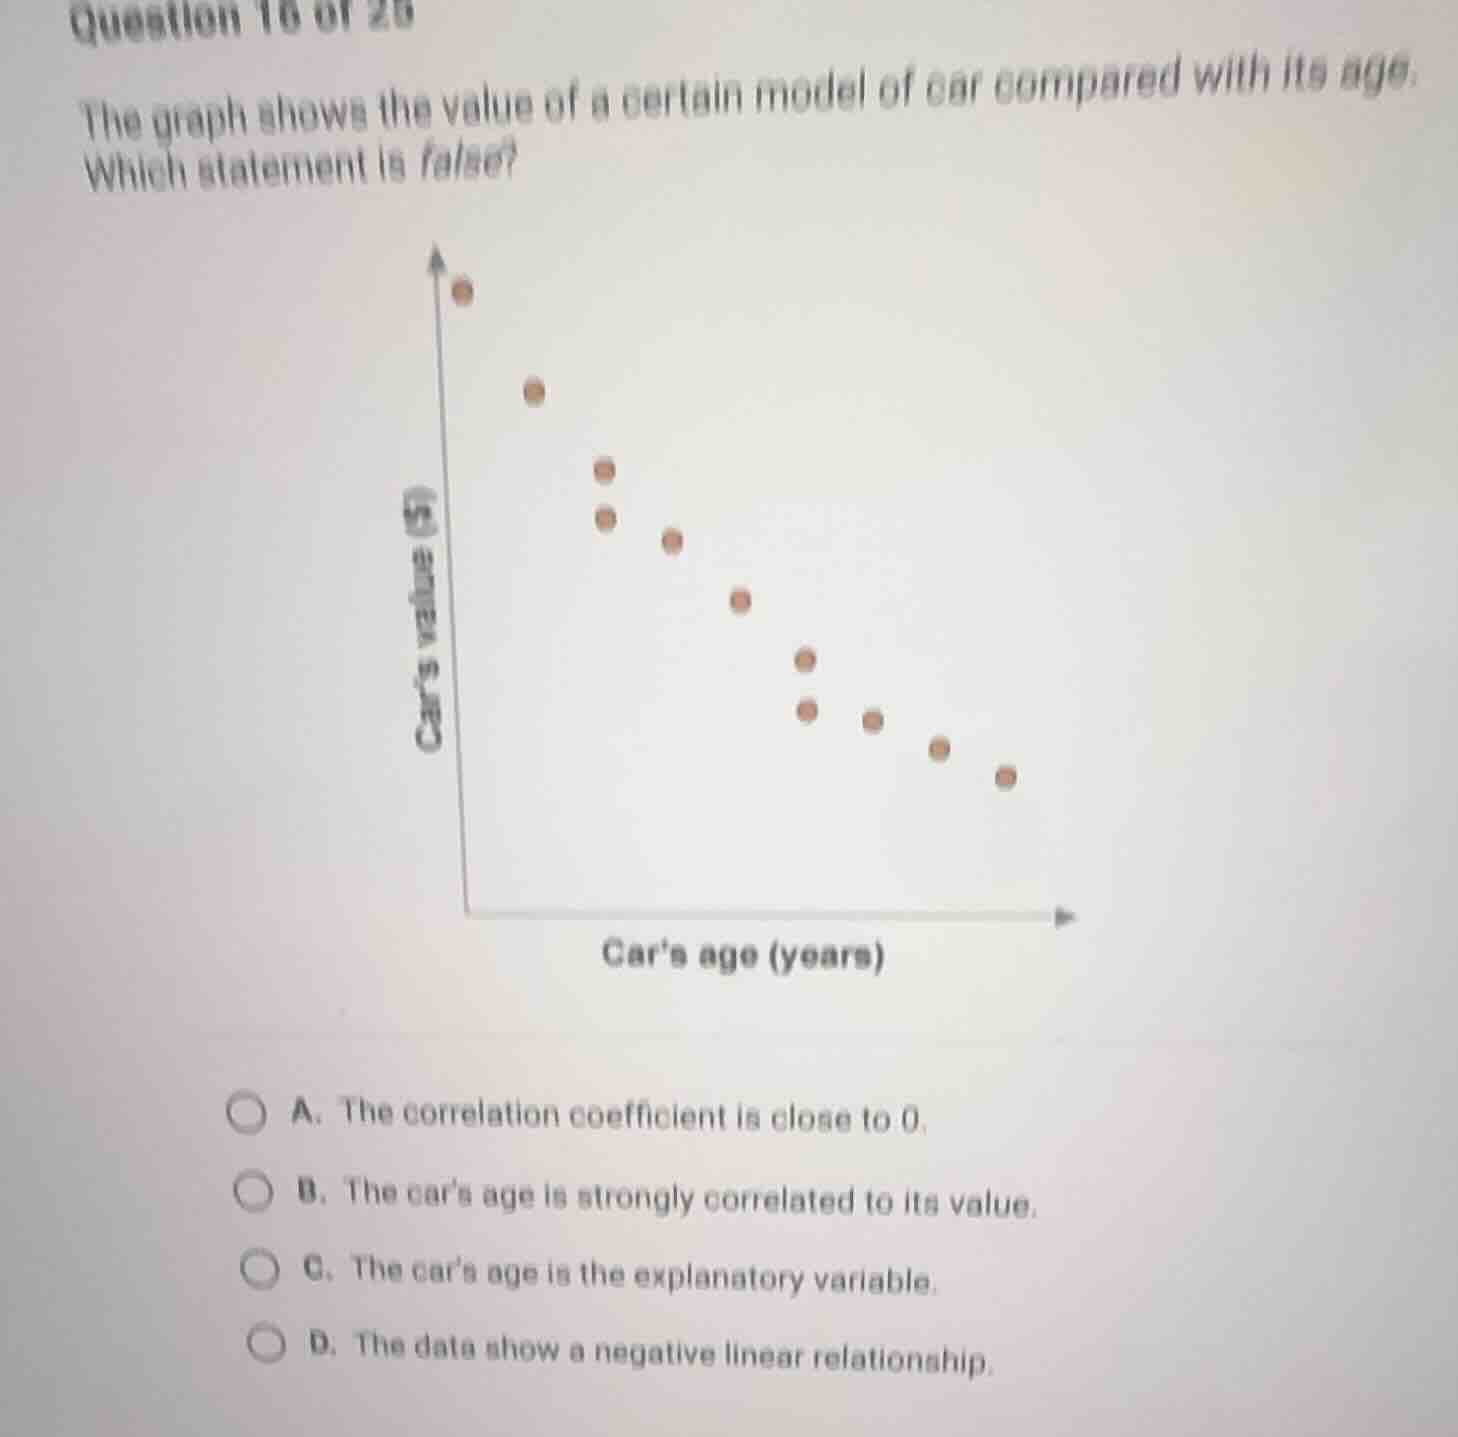
the graph shows the value of a certain model of car compared with its age. which statement is false?
cars value ($)
cars age (years)
a. the correlation coefficient is close to 0.
b. the cars age is strongly correlated to its value.
c. the cars age is the explanatory variable.
d. the data show a negative linear relationship.
Analyze the scatter plot
The scatter plot shows a clear downward trend from left to right. As the car's age (on the horizontal axis) increases, the car's value (on the vertical axis) decreases.
Evaluate the statements
- Statement A: "The correlation coefficient is close to 0." This is false because the points lie very close to a straight line, indicating a strong negative correlation (close to -1, not 0).
- Statement B: "The car's age is strongly correlated to its value." This is true because the points are tightly clustered around a linear trend.
- Statement C: "The car's age is the explanatory variable." This is true because age is plotted on the horizontal x-axis.
- Statement D: "The data show a negative linear relationship." This is true because the value decreases linearly as age increases.
Identify the false statement
Since Statement A is false, it is the correct answer to the question "Which statement is false?".

Snap & solve any problem in the app
Get step-by-step solutions on Sovi AI
Photo-based solutions with guided steps
Explore more problems and detailed explanations
- A. The correlation coefficient is close to 0. (Correct answer)
- B. The car's age is strongly correlated to its value.
- C. The car's age is the explanatory variable.
- D. The data show a negative linear relationship.