QUESTION IMAGE
Question
question 15 (mandatory) (3.0303 points)
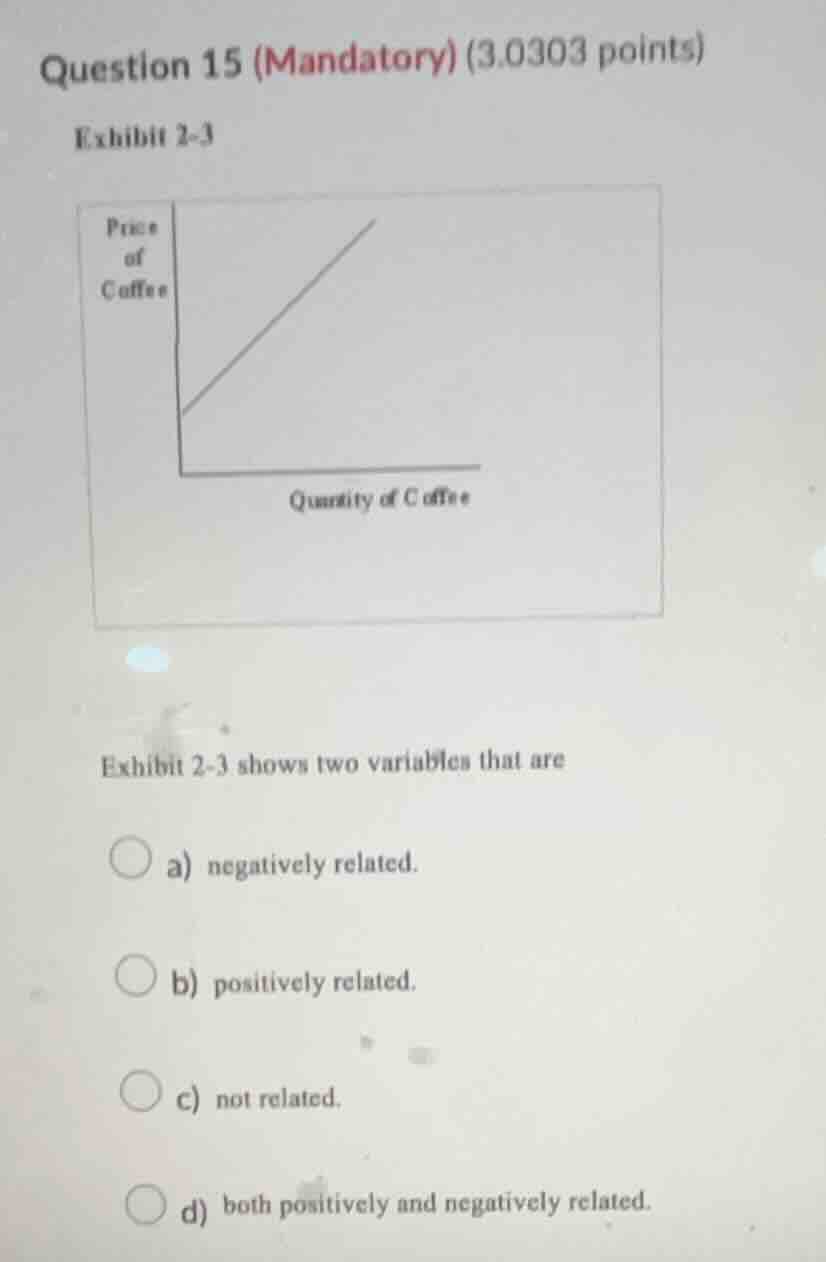
exhibit 2-3
chart: price of coffee (y-axis), quantity of coffee (x-axis), upward - sloping line
exhibit 2 - 3 shows two variables that are
a) negatively related.
b) positively related.
c) not related.
d) both positively and negatively related.
Brief Explanations
A positively related relationship between two variables means that as one variable increases, the other also increases. The graph shows that as the quantity of coffee (horizontal axis) rises, the price of coffee (vertical axis) rises, which matches this definition.

Snap & solve any problem in the app
Get step-by-step solutions on Sovi AI
Photo-based solutions with guided steps
Explore more problems and detailed explanations
b) positively related.