QUESTION IMAGE
Question
question 13 (multiple choice worth 1 points)
(linear functions fit to data mc)
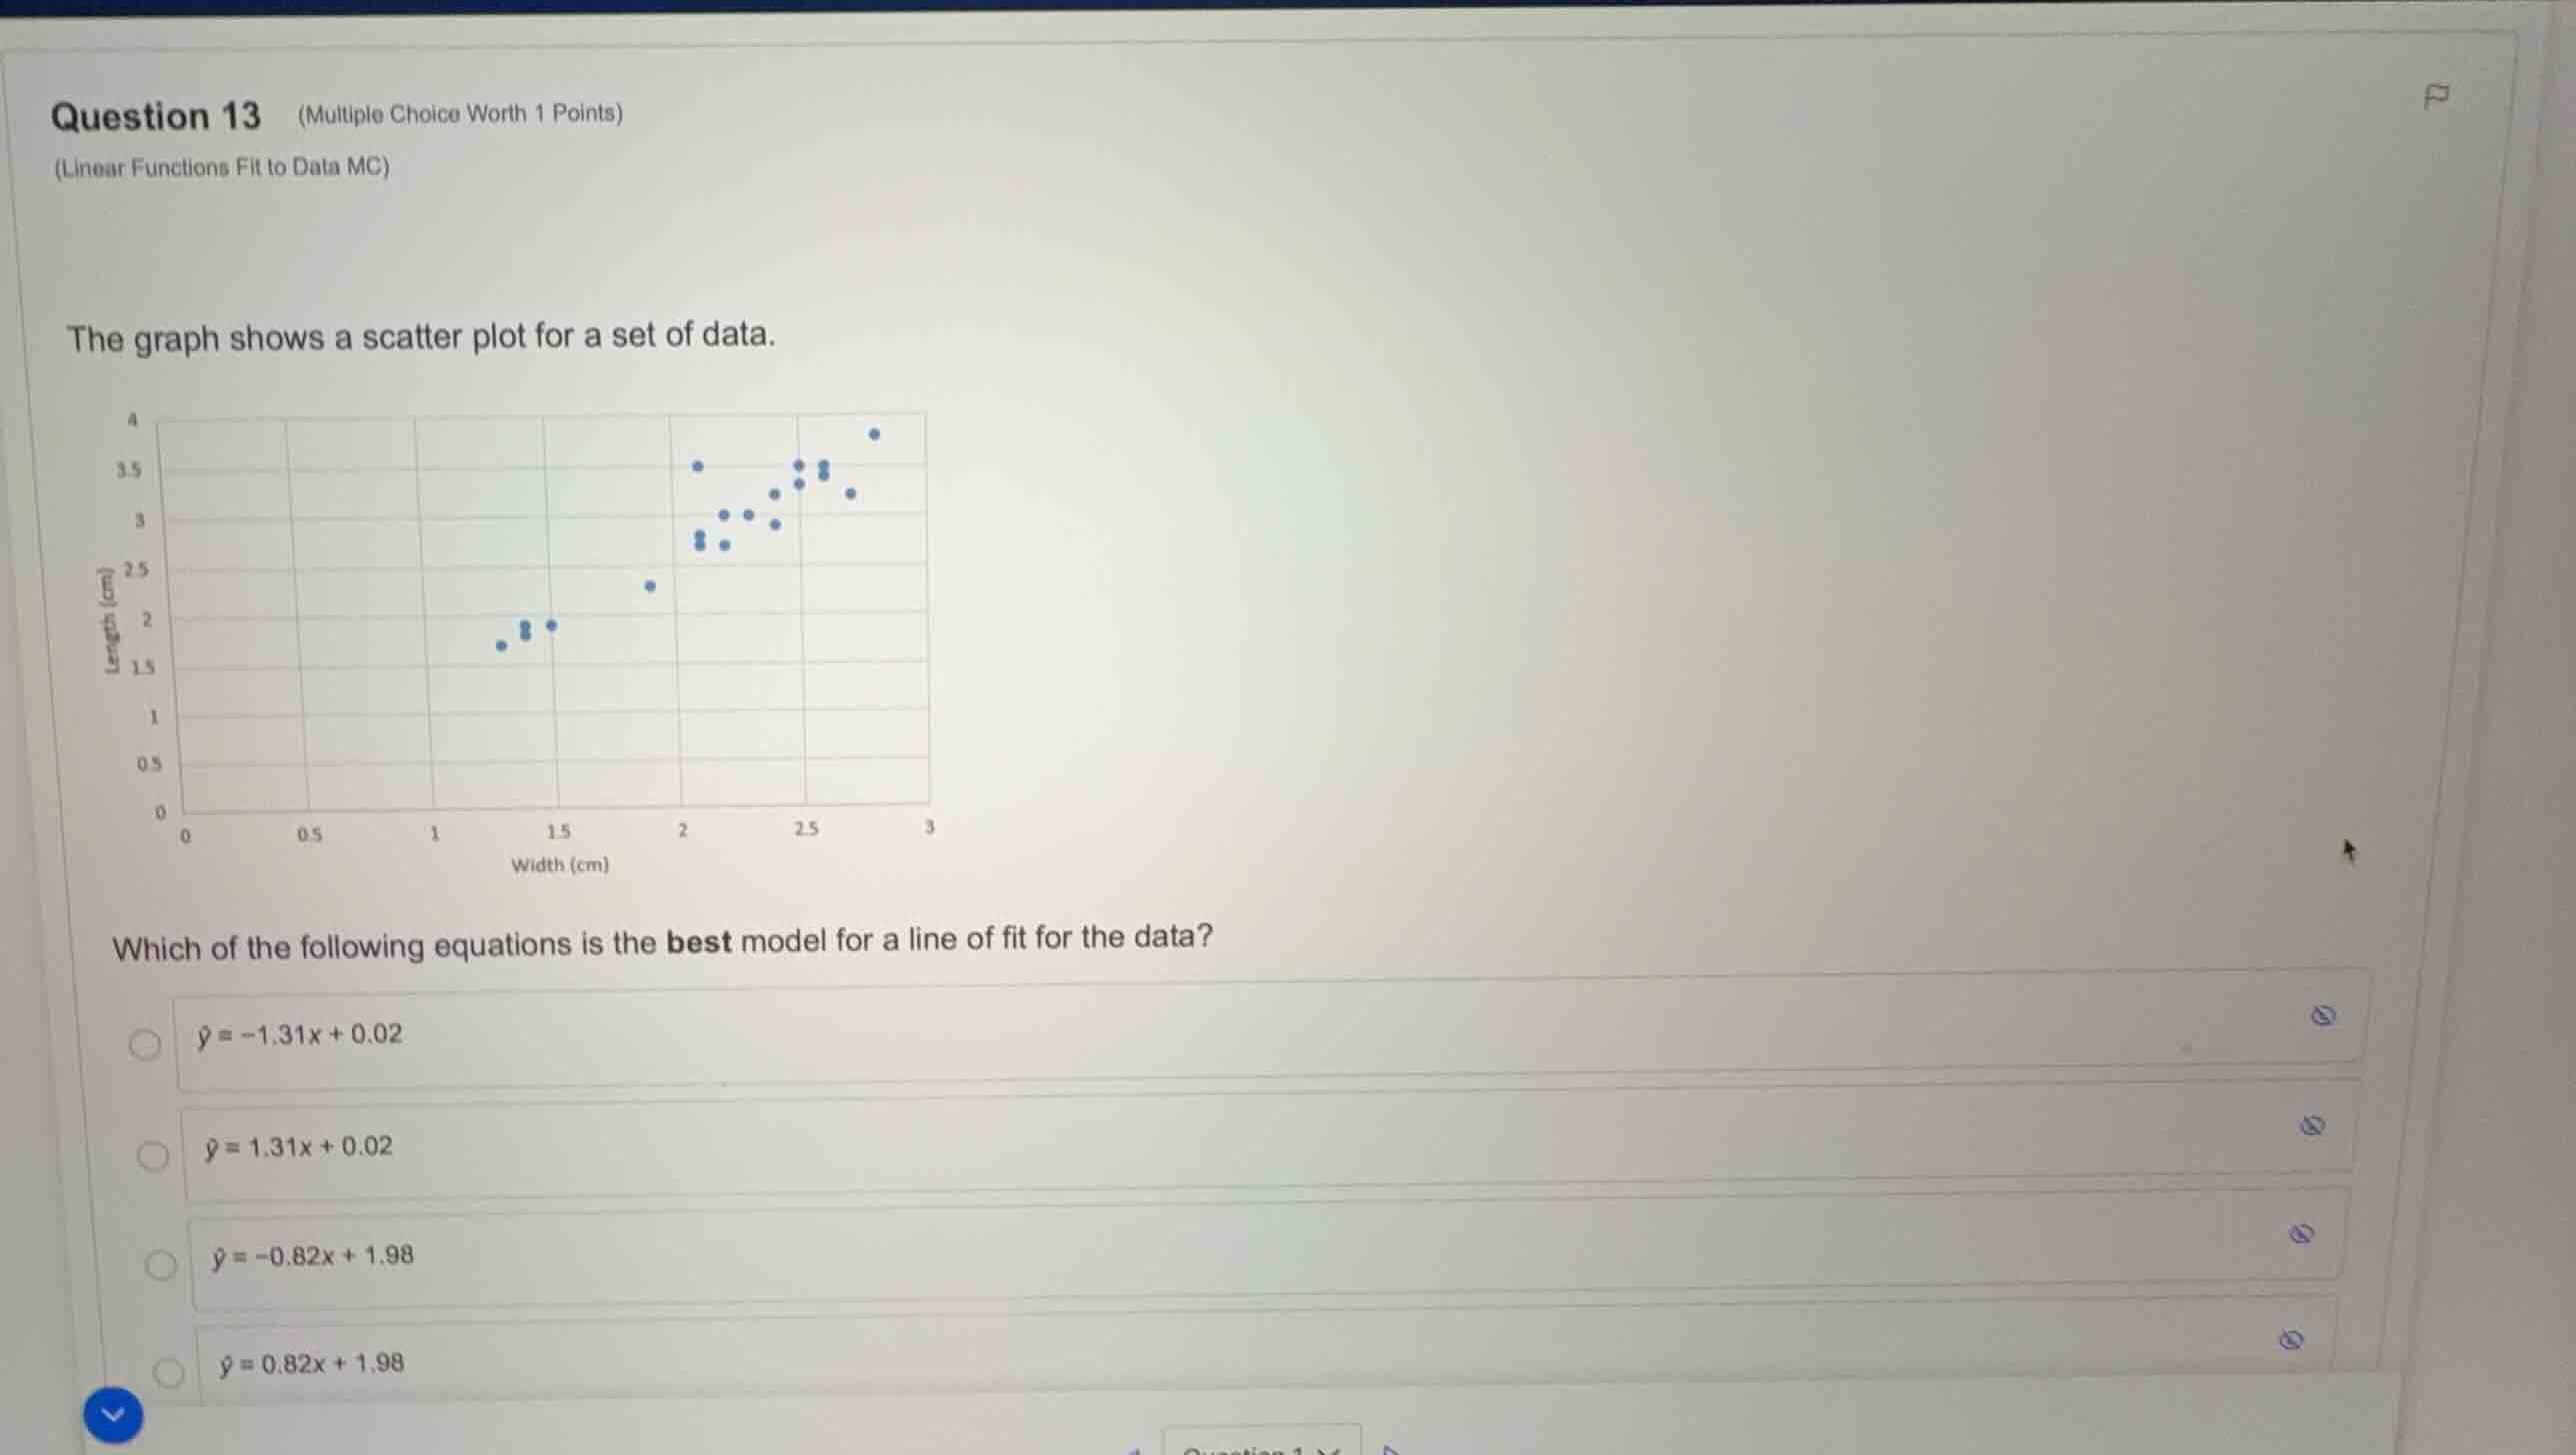
the graph shows a scatter plot for a set of data.
which of the following equations is the best model for a line of fit for the data?
\\(\hat{y} = -1.31x + 0.02\\)
\\(\hat{y} = 1.31x + 0.02\\)
\\(\hat{y} = -0.82x + 1.98\\)
\\(\hat{y} = 0.82x + 1.98\\)
Determine the sign of the slope
The scatter plot shows that as the width (\(x\)) increases, the length (\(y\)) also increases. This indicates a positive correlation, meaning the slope (\(m\)) of the line of best fit must be positive:
Estimate the slope and intercept using data points
Select two representative points from the trend of the data:
Calculate the approximate slope:
Calculate the approximate \(y\)-intercept using \(y - mx = b\):
Compare with the given options
Compare the calculated values \(m \approx 1.21\) and \(b \approx 0.23\) with the positive-slope options:
- \(\hat{y} = 1.31x + 0.02\) (Slope \(1.31\), Intercept \(0.02\))
- \(\hat{y} = 0.82x + 1.98\) (Slope \(0.82\), Intercept \(1.98\))
The option \(\hat{y} = 1.31x + 0.02\) is the closest match to the data.

Snap & solve any problem in the app
Get step-by-step solutions on Sovi AI
Photo-based solutions with guided steps
Explore more problems and detailed explanations
- (A) \(\hat{y} = -1.31x + 0.02\)
- (B) \(\hat{y} = 1.31x + 0.02\) (Correct answer)
- (C) \(\hat{y} = -0.82x + 1.98\)
- (D) \(\hat{y} = 0.82x + 1.98\)