QUESTION IMAGE
Question
question 10 (5 points)
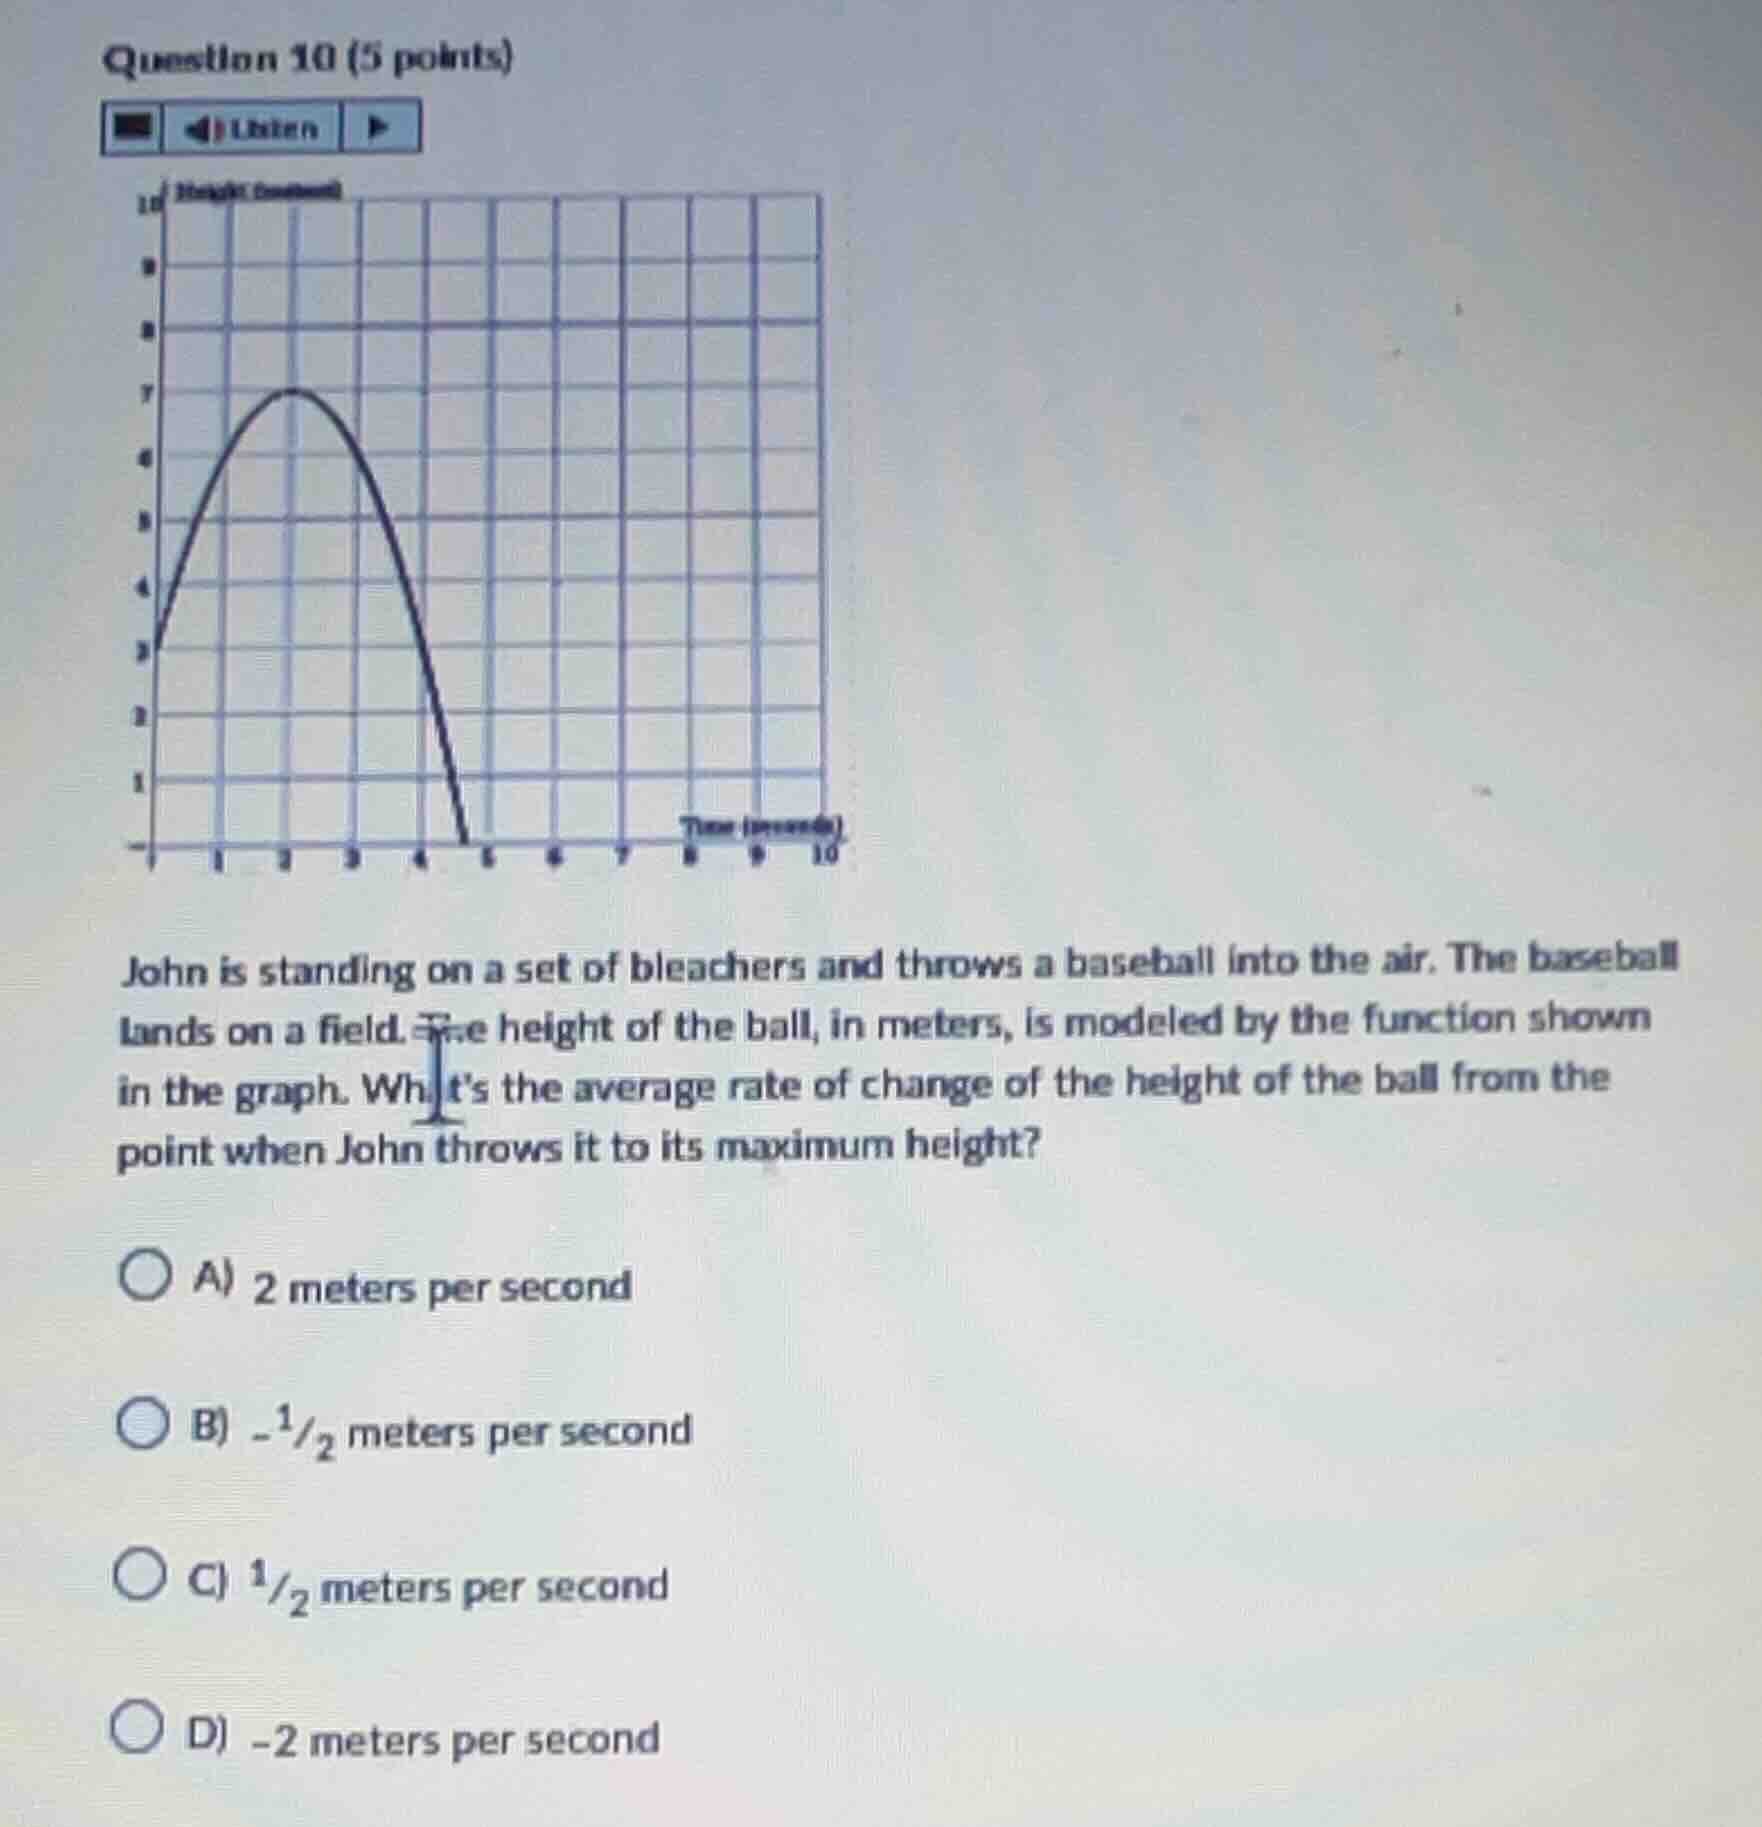
john is standing on a set of bleachers and throws a baseball into the air. the baseball lands on a field. the height of the ball, in meters, is modeled by the function shown in the graph. whats the average rate of change of the height of the ball from the point when john throws it to its maximum height?
a) 2 meters per second
b) \\(-\frac{1}{2}\\) meters per second
c) \\(\frac{1}{2}\\) meters per second
d) -2 meters per second
Identify the initial point
The initial point represents when John throws the baseball, which corresponds to the time \(t = 0\) seconds. Looking at the vertical axis (y-axis) where \(t = 0\), the height of the ball is \(3\) meters.
Thus, the initial point is \((0, 3)\).
Identify the maximum height point
The maximum height of the ball corresponds to the vertex of the parabola. Looking at the graph, the peak of the curve occurs at \(t = 2\) seconds, where the height reaches \(7\) meters.
Thus, the maximum point is \((2, 7)\).
Calculate the average rate of change
The average rate of change between two points \((t_1, y_1)\) and \((t_2, y_2)\) is given by the formula:
Substituting our points \((0, 3)\) and \((2, 7)\):

Snap & solve any problem in the app
Get step-by-step solutions on Sovi AI
Photo-based solutions with guided steps
Explore more problems and detailed explanations
- A) 2 meters per second (Correct answer)
- B) -1/2 meters per second
- C) 1/2 meters per second
- D) -2 meters per second