QUESTION IMAGE
Question
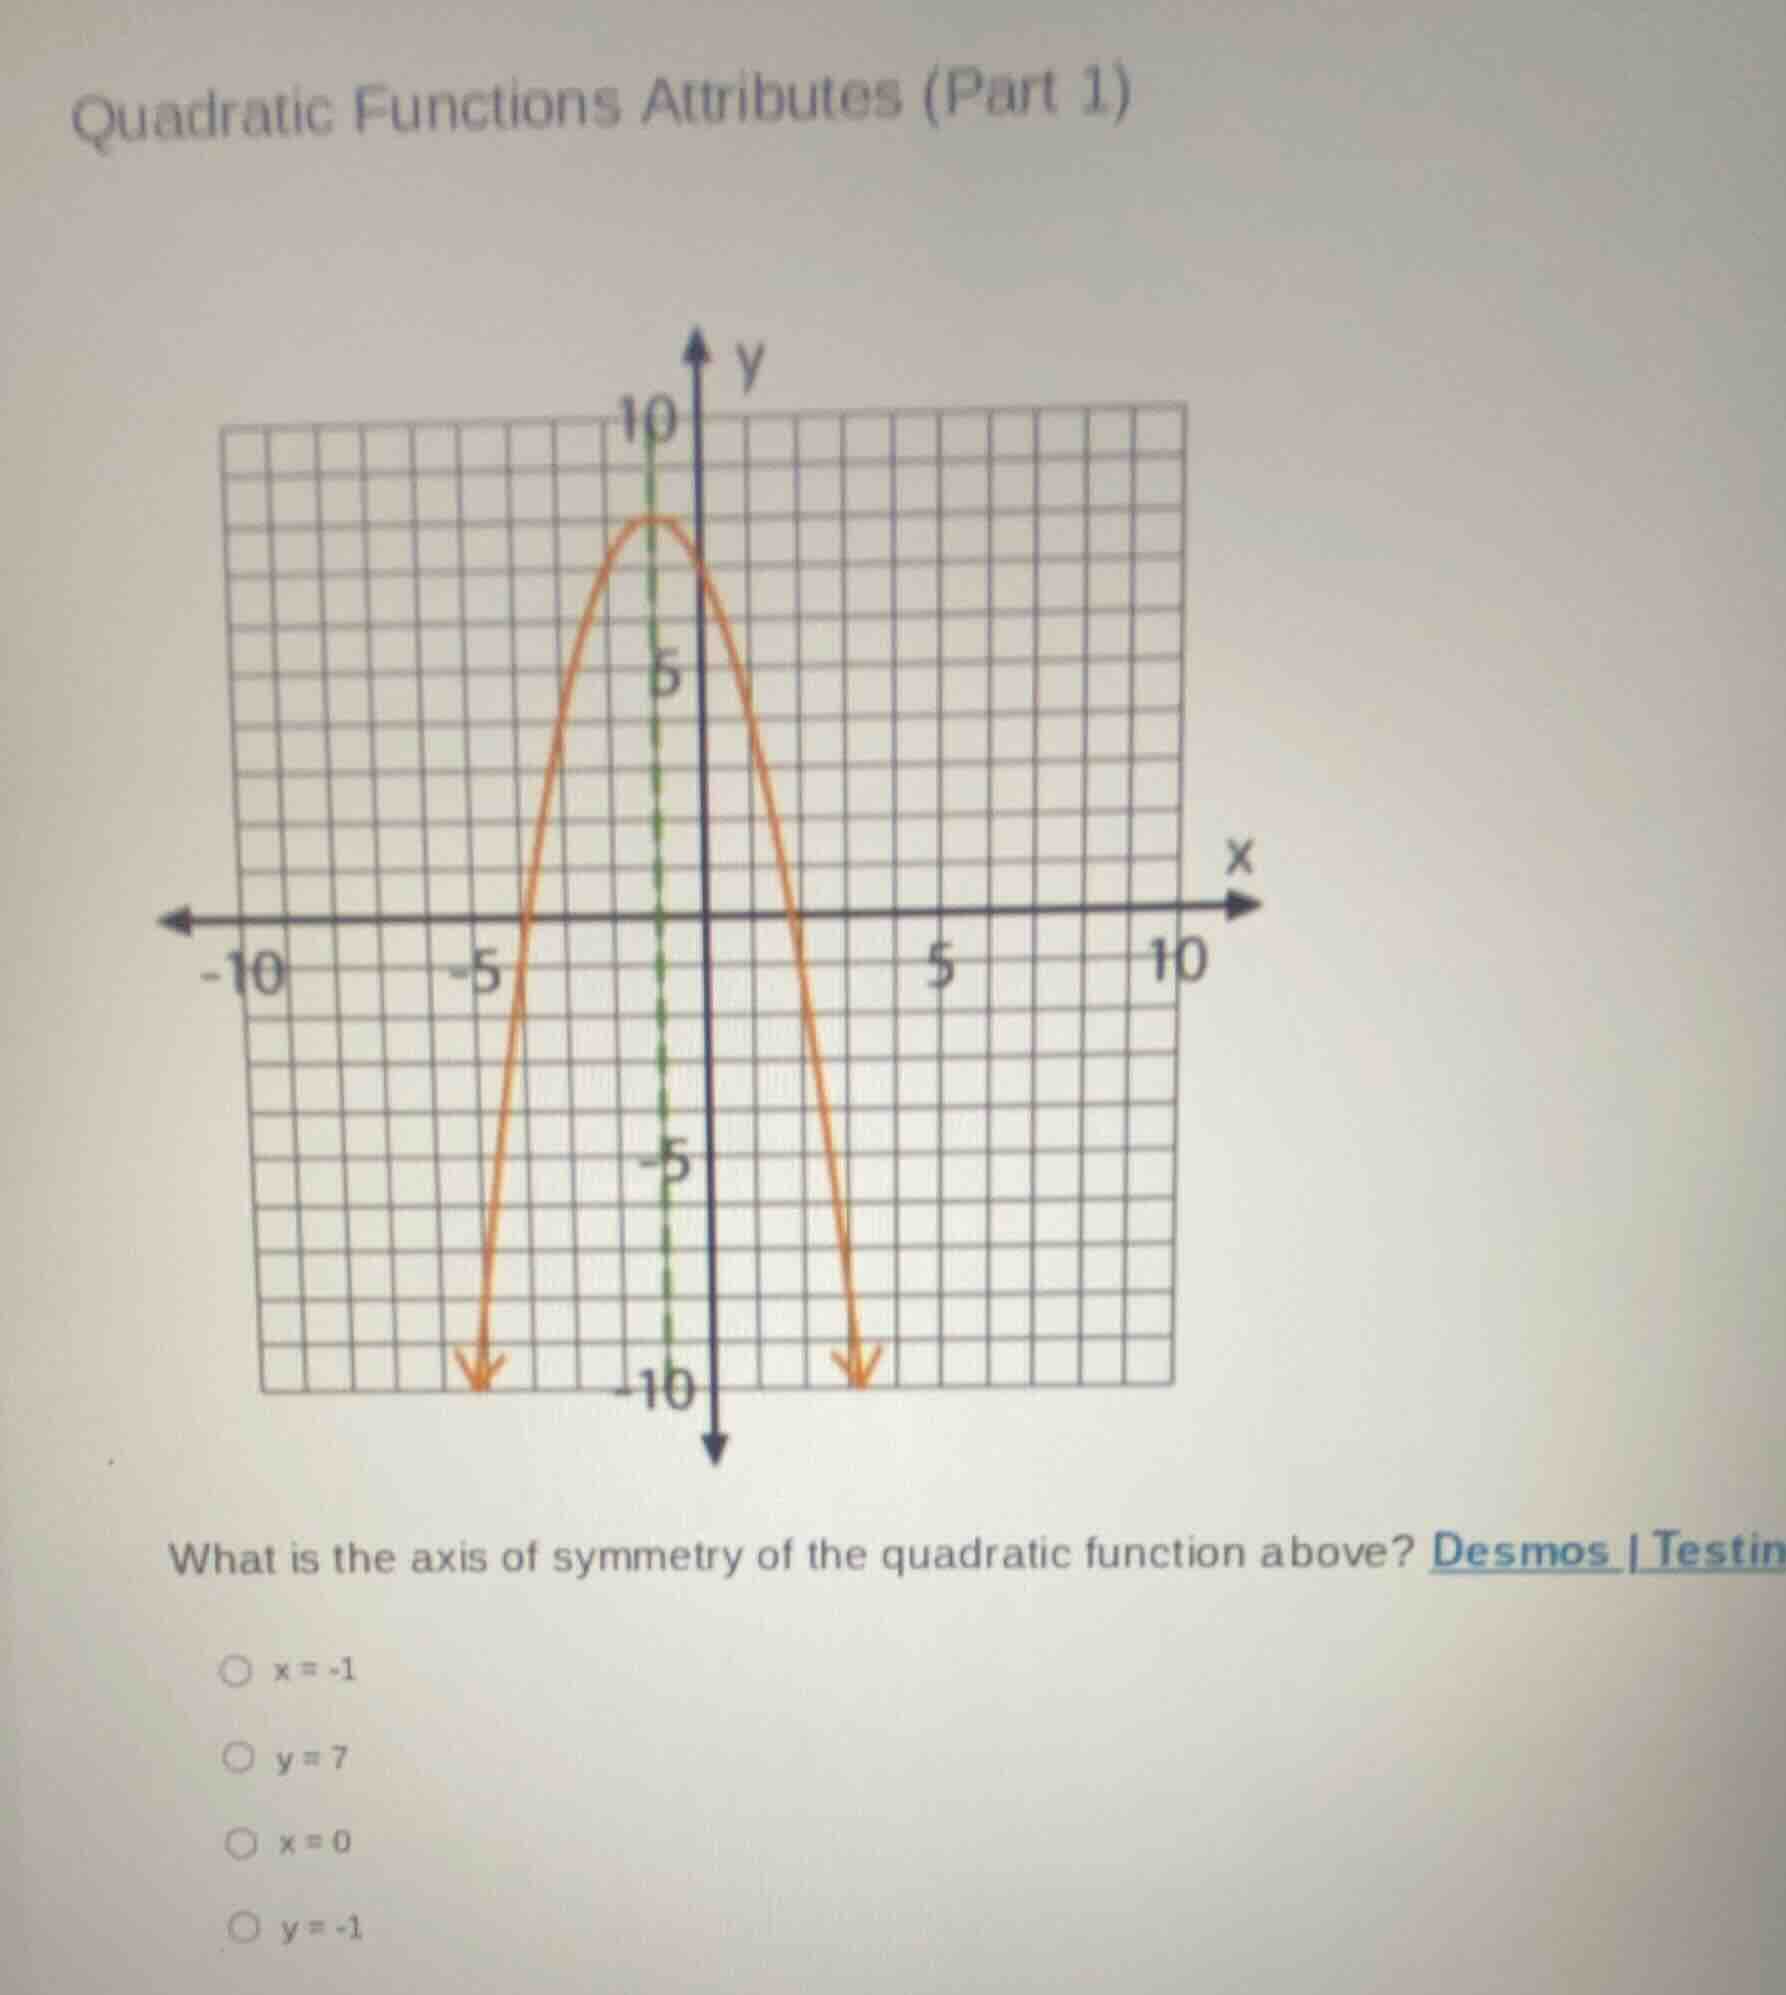
quadratic functions attributes (part 1)
what is the axis of symmetry of the quadratic function above? desmos | testin
\\(\circ\\) \\(x = -1\\)
\\(\circ\\) \\(y = 7\\)
\\(\circ\\) \\(x = 0\\)
\\(\circ\\) \\(y = -1\\)
Step1: Recall axis of symmetry
The axis of symmetry of a parabola (quadratic function graph) is a vertical line that divides the parabola into two mirror - image halves. For a parabola, the equation of the axis of symmetry is of the form \(x = h\), where \(h\) is the x - coordinate of the vertex.
Step2: Identify the vertex's x - coordinate
From the graph, we can see that the vertex of the parabola lies on the vertical line \(x=- 1\)? Wait, no, looking at the green dashed line (axis of symmetry) in the graph, it is at \(x = - 1\)? Wait, no, wait the grid: let's check the x - coordinate of the vertex. Wait, the green dashed line is at \(x=-1\)? Wait, no, maybe I misread. Wait, the graph: the vertex is at \(x=-1\)? Wait, no, let's look at the options. Wait, the options are \(x = - 1\), \(y = 7\), \(x = 0\), \(y=-1\). Wait, the axis of symmetry is a vertical line, so it must be in the form \(x=\text{constant}\). So we can eliminate \(y = 7\) and \(y=-1\) because they are horizontal lines. Now, looking at the graph, the axis of symmetry (the green dashed line) is at \(x=-1\)? Wait, no, wait the grid: each square is 1 unit. Let's see the vertex: the peak of the parabola is at \(x=-1\)? Wait, no, maybe I made a mistake. Wait, the graph: the vertical line (axis of symmetry) is at \(x=-1\)? Wait, the options: \(x=-1\) is an option. Wait, let's re - check. The axis of symmetry for a parabola \(y = ax^{2}+bx + c\) is given by \(x=-\frac{b}{2a}\), but from the graph, we can visually see the axis of symmetry. The parabola is symmetric about the vertical line that passes through its vertex. Looking at the graph, the vertex is at \(x = - 1\)? Wait, no, wait the green line: in the graph, the green dashed line is at \(x=-1\)? Wait, maybe the correct answer is \(x=-1\)? Wait, no, wait the options: \(x=-1\) is option A. Wait, let's confirm. The axis of symmetry is a vertical line, so \(x=\text{value}\). The vertex's x - coordinate is the axis of symmetry. From the graph, the vertex is at \(x=-1\), so the axis of symmetry is \(x=-1\). Wait, but let's check again. Wait, maybe I misread the graph. Wait, the grid: the x - axis and y - axis. The vertex is at \(x=-1\), so the axis of symmetry is \(x=-1\).

Snap & solve any problem in the app
Get step-by-step solutions on Sovi AI
Photo-based solutions with guided steps
Explore more problems and detailed explanations
\(x=-1\) (corresponding to the option \(x = - 1\))